
An AI marketing report that never invents numbers
An AI marketing report with a full P&L, ROAS and cohorts, where every number is computed in code.
 Meta Ads
 Google Ads
 TikTok Ads
 Snapchat Ads
 Moloco Ads
What is an AI marketing report?
An AI marketing report is a periodic document about paid media performance in which every number is computed in code from the ad accounts and the AI only writes the interpretation, so no figure can be invented or rounded from memory.
- A full P&L, ROAS, funnel, cohort and campaign report in minutes
- The prior period is computed alongside for comparison
- Verdicts and recommendations are generated on top of fixed numbers
- ROAS and payback are measured against real revenue
From a period to a full AI marketing report in 5 steps
Generate a report
Pick the period — day, week, month or all-time — and the model, then hit generate.
- A deeper model for maximum analysis or a faster one for a quick turnaround
- AdBid collects the data and computes your P&L, ROAS and cohorts
- It builds the charts and lets the AI write the verdict
Numbers computed in code
Gross revenue, ad spend, clean profit, ROAS and net ROI are calculated deterministically from your accounts — each with its delta against the prior period.
- The AI writes the story around those figures but never the figures themselves
- Nothing is hallucinated
- By the time the model sees the report, the arithmetic is already finished
Navigate the report map
Jump straight to what matters through the report map — Executive, P&L, Funnel, Cohorts, Campaigns, Geo and Products.
- Each section carries a health status
- A red dot tells you where to look before you read a word
- A heavy month turns into a short list of places worth opening
Read the charts & tables
A P&L waterfall shows where revenue turns into profit, cohort heat maps track billing over time, and funnels expose every drop-off.
- Tables come with verdicts — scale, watch or stop
- The read is done for you
Ask the AI anything
Ask a question in plain language and get an answer grounded strictly in the report.
- Drill-downs into the exact geo, campaign or product, plus suggested follow-ups
- Every report is saved to history so you can compare periods later
- Answers cannot introduce a number the report does not contain
Get started in 5 steps
Connect ad accounts and product data
Meta, Google, TikTok plus revenue and event sources.
Attribution attaches itself
Spend, installs, events and revenue land in one measurement layer at no extra charge.
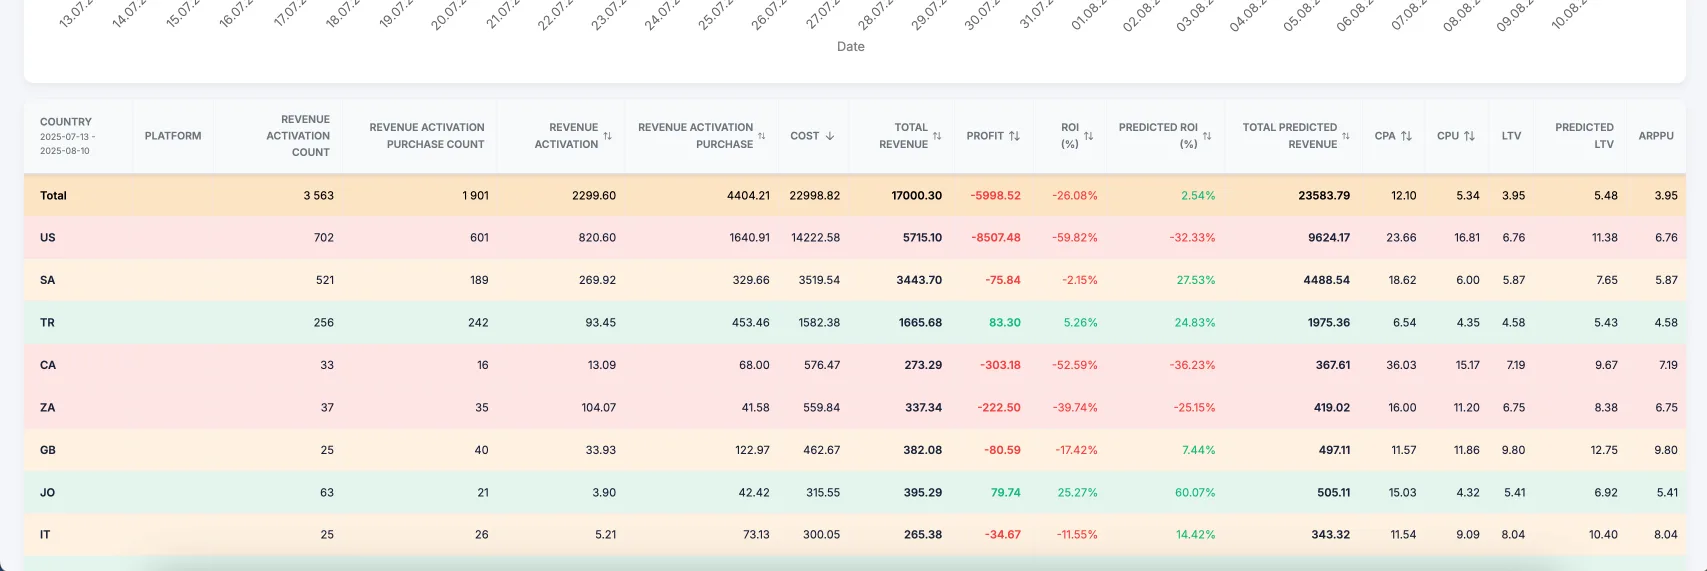
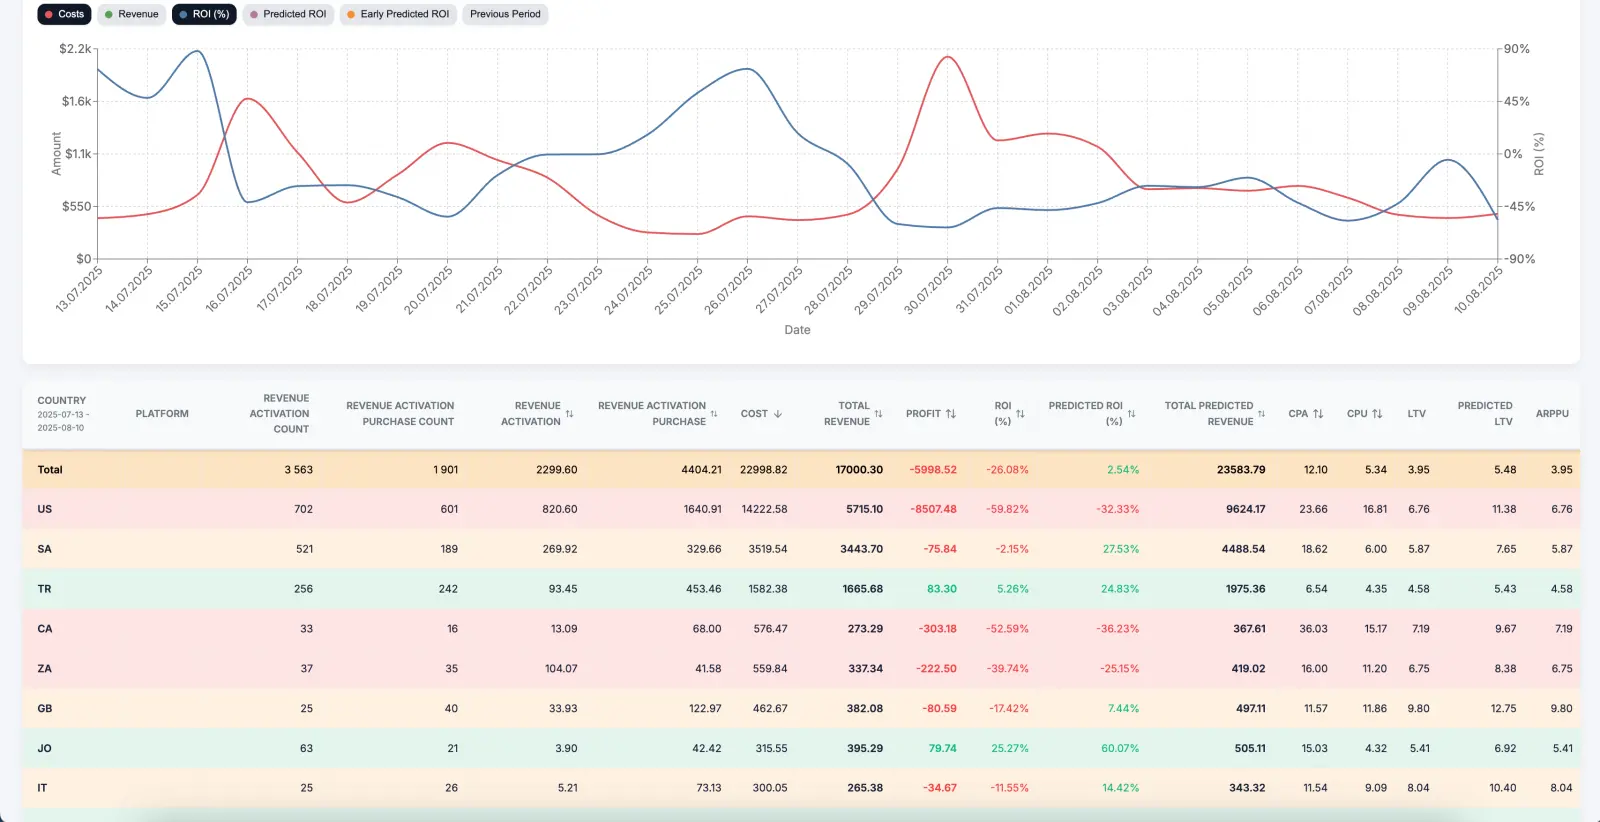
Read ROAS, LTV and cohorts in one table
Every view stays in sync with the same underlying data.
Ask the AI analyst or run a report
Plain-language questions, numbers computed in code.
Hand decisions to Autopilot
Scale what pays back; decisions carry the rule and threshold behind them.
Common questions
Open the next layer
Guides & resources





Put this to work on your paid media.
Works with Meta, Google, TikTok, Snapchat and Moloco. Attribution is included.