
AI marketing analytics: every ad metric in one live dashboard
AI marketing analytics that reads spend, revenue, ROAS, LTV and cohorts from one live source of truth.
 Meta Ads
 Google Ads
 TikTok Ads
 Snapchat Ads
 Moloco Ads
What is AI marketing analytics?
AI marketing analytics is the practice of pulling spend, revenue, ROAS, LTV and cohort data from every ad channel into one live source of truth and letting AI read it, so a team decides what to scale from facts rather than from platform dashboards that disagree.
- Collects metrics from connected Meta, Google and TikTok ad accounts
- Updates in real time, from the top-line table down to a single cohort
- Every view stays in sync with the same underlying data
- Free attribution and predictive LTV feed the same tables
Read your AI marketing analytics in 4 views
Overview
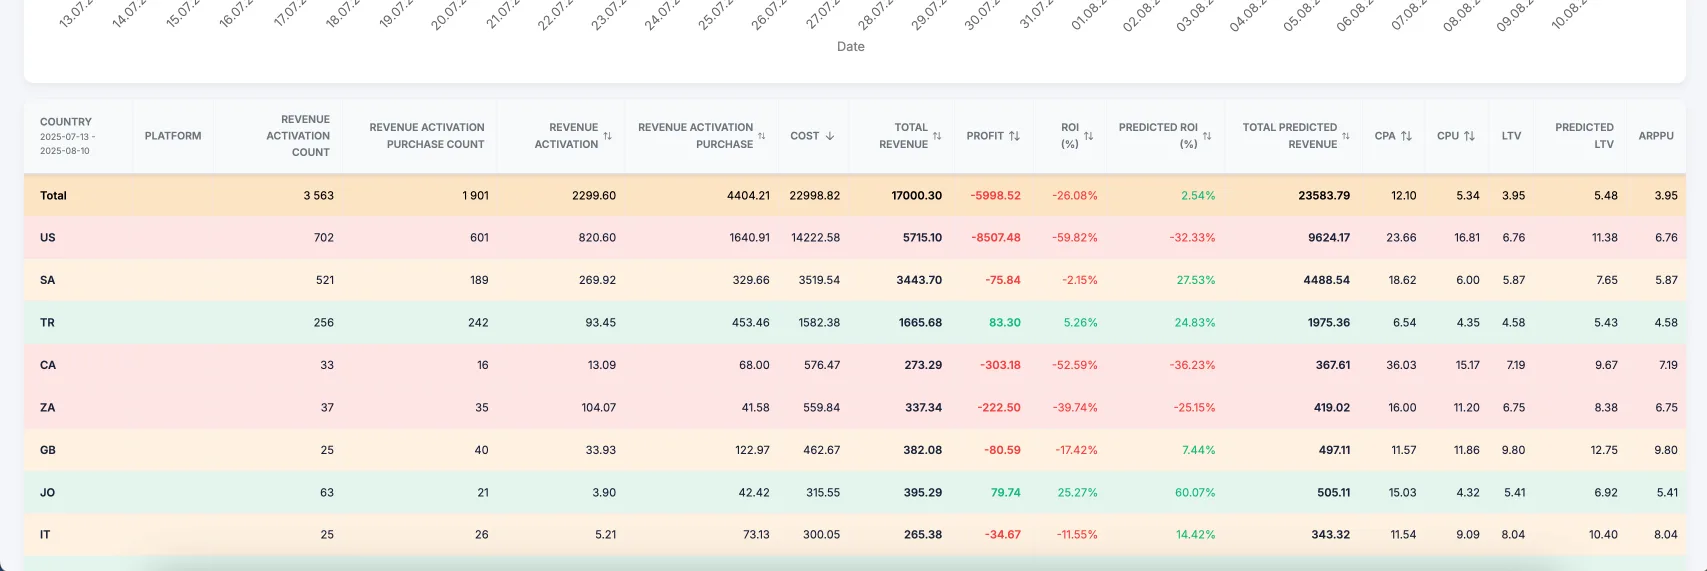
The numbers that matter, grouped the way you work — pick an app, a date range and a grouping, and every metric lines up in one table.
- Cost, Gross revenue, ROAS, CPA, installs and more, with a Totals row on top
- Group by date, campaign or country and drill straight in
- The Totals row stays put as you regroup
Charts
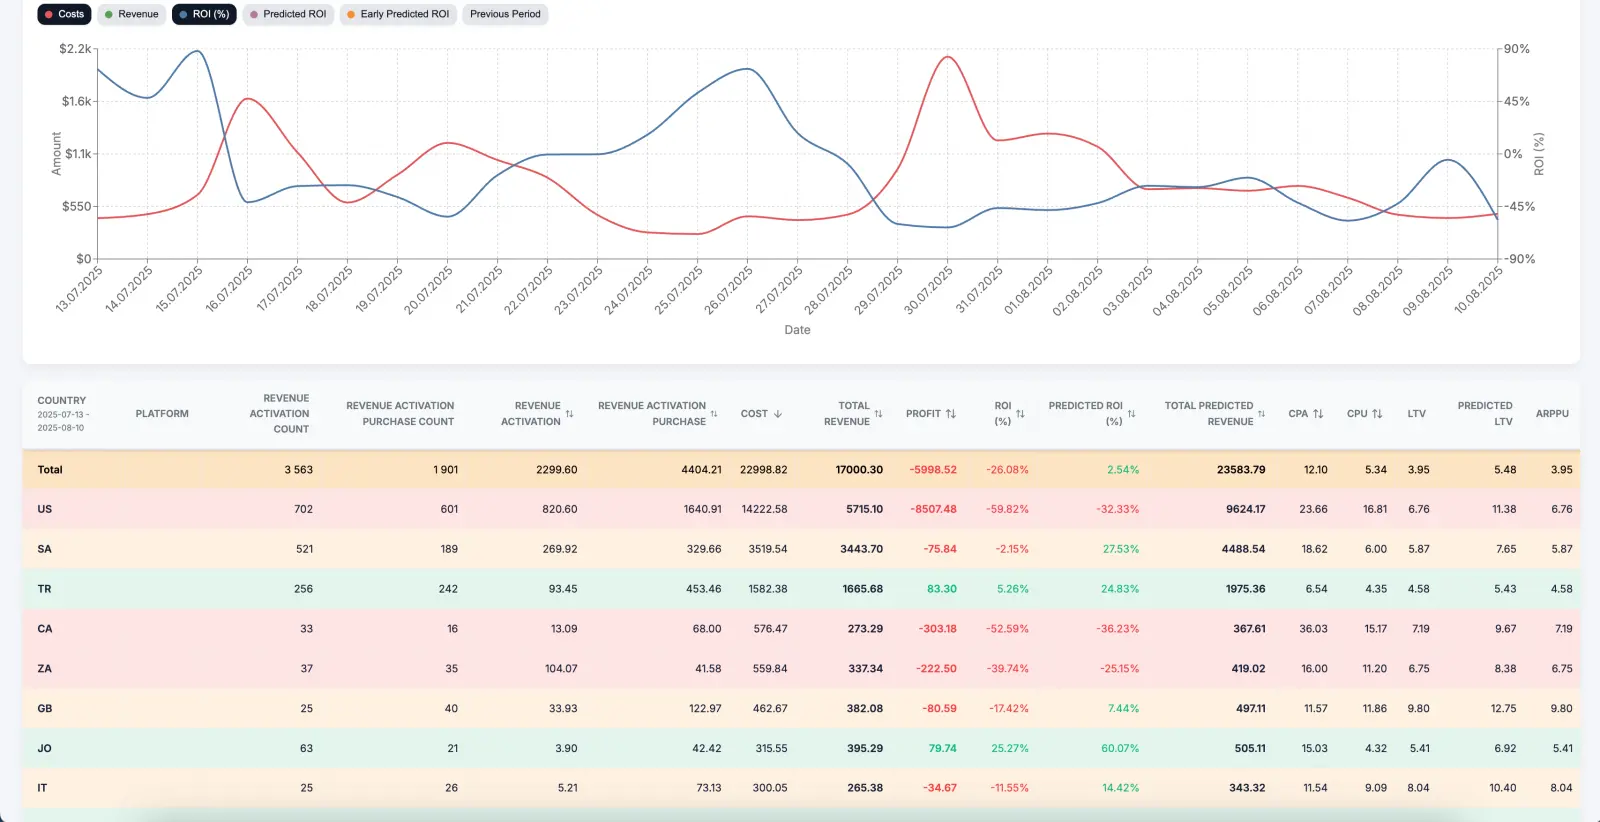
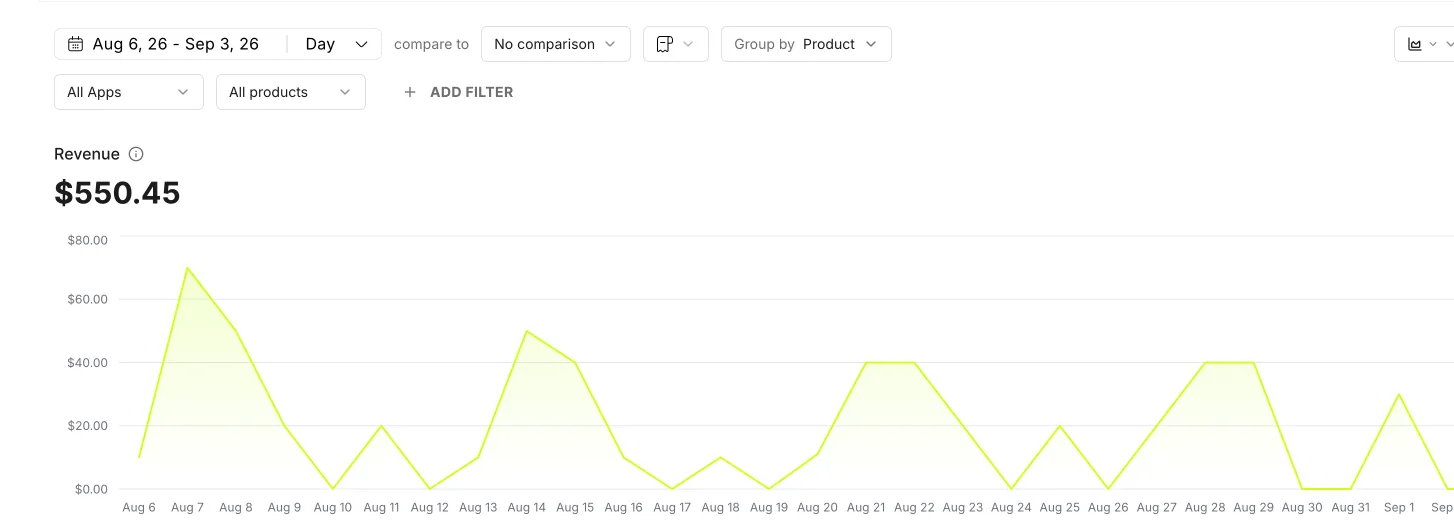
Pick any metric from the sidebar — revenue, MRR, ARPU, installs, trials — and plot it over time.
- The headline shows the total for the period while the chart draws the trend
- Compare periods or break it down by product in a click
LTV
Watch cumulative revenue per paying user build across P0 to P12, one curve per cohort.
- Group by day, week, product or country
- Toggle the series you care about to see which cohorts pay back fastest
- Comparing curves rather than end points shows which cohort is still climbing
Cohorts
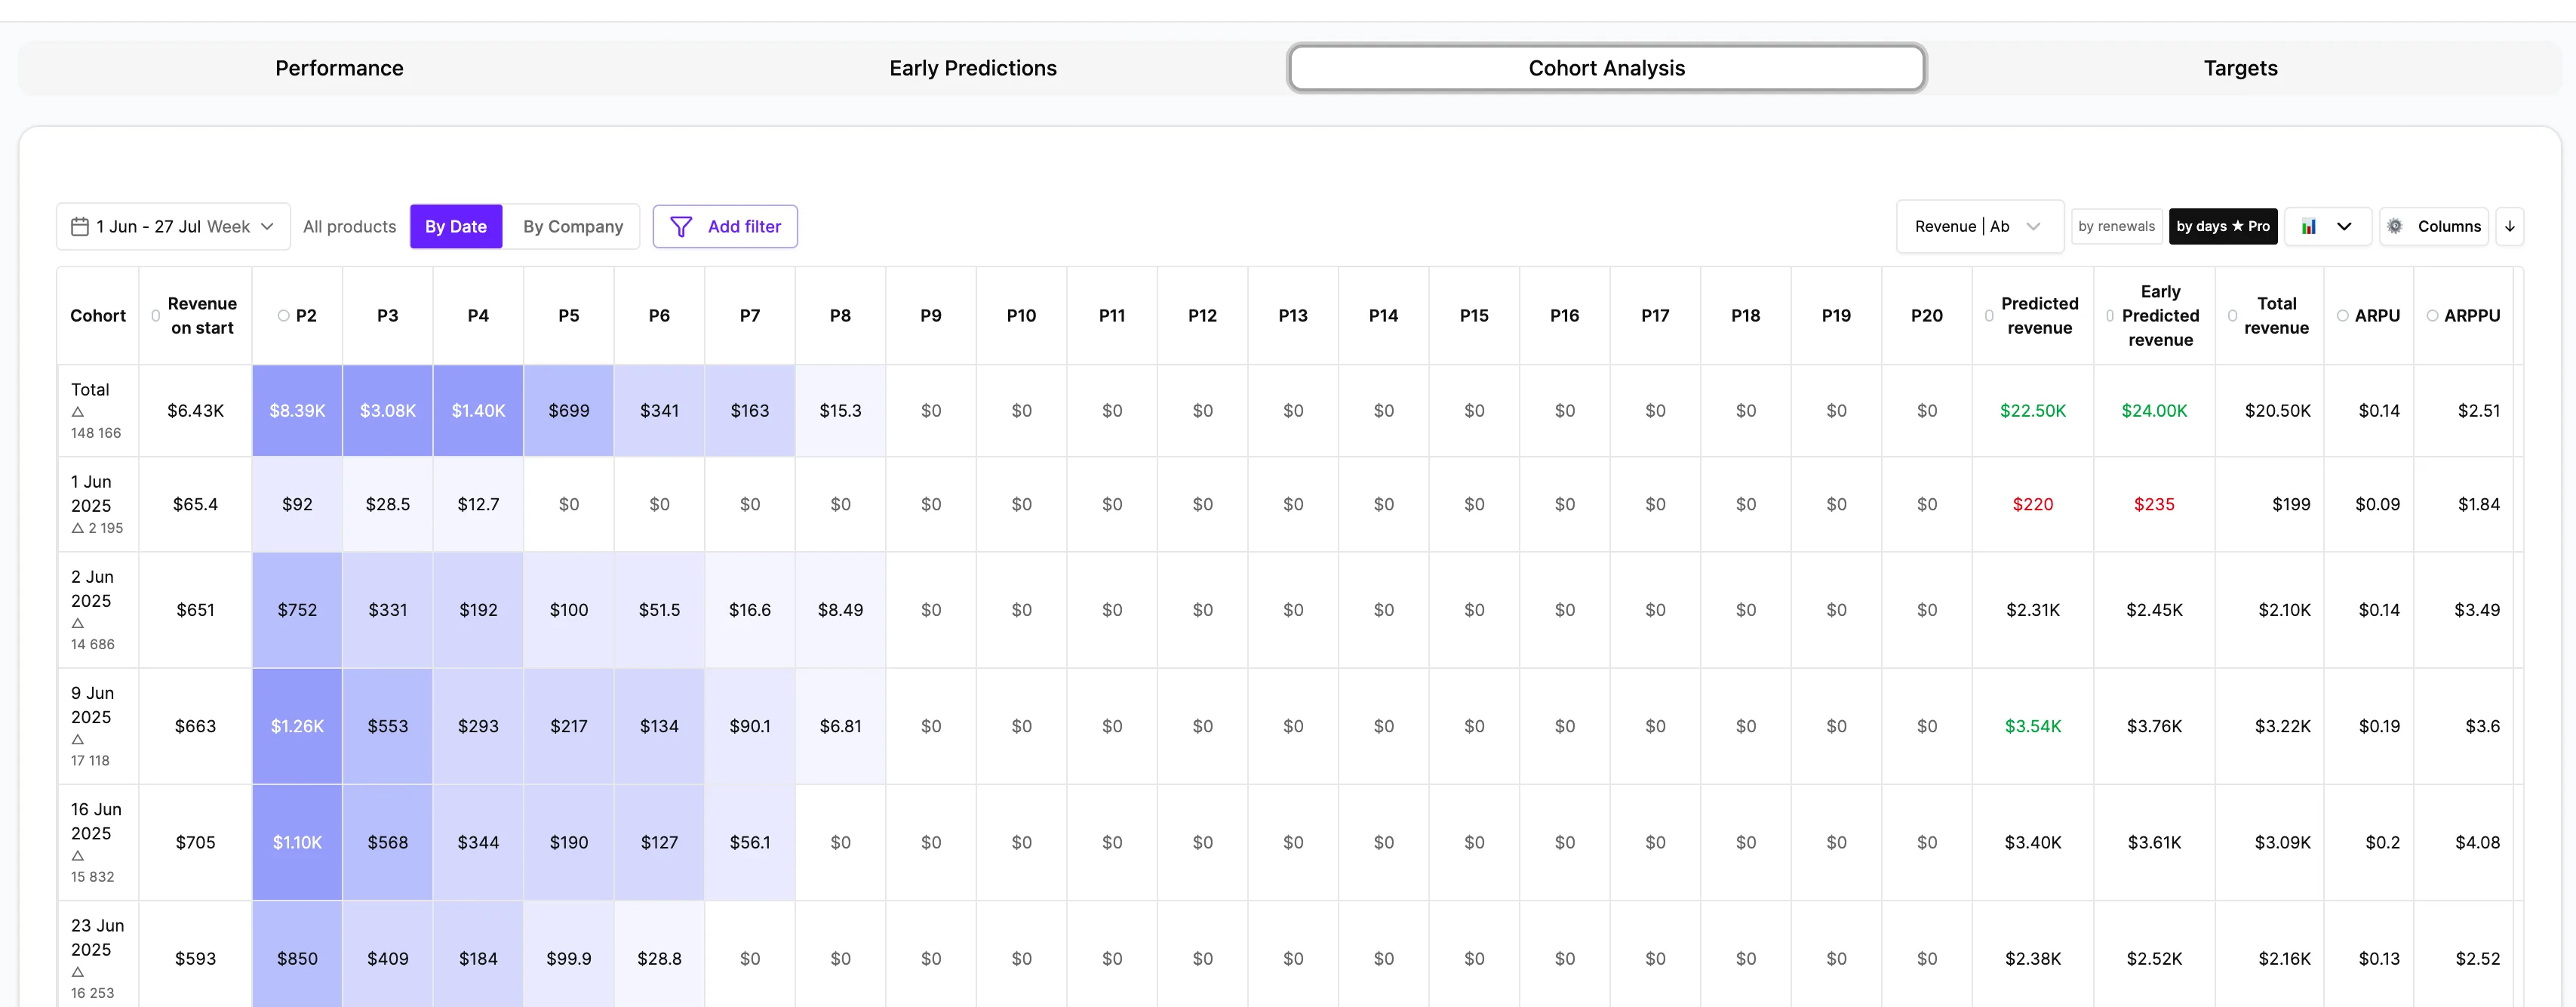
Group users by the week they arrived and watch cumulative revenue build across day buckets — 0d, 7d, 28d, 92d — or renewal periods.
- A lime heat map makes the strongest and weakest cohorts jump off the screen
- ROI, ARPU, profit and predicted LTV all alongside
- Reading the map by column tells you whether a weak week was acquisition or retention
Get started in 5 steps
Connect ad accounts and product data
Meta, Google, TikTok plus revenue and event sources.
Attribution attaches itself
Spend, installs, events and revenue land in one measurement layer at no extra charge.
Read ROAS, LTV and cohorts in one table
Every view stays in sync with the same underlying data.
Ask the AI analyst or run a report
Plain-language questions, numbers computed in code.
Hand decisions to Autopilot
Scale what pays back; decisions carry the rule and threshold behind them.
Common questions
Open the next layer
Guides & resources





Put AI marketing analytics: every ad metric in one live dashboard to work on your paid media.
Works with Meta, Google, TikTok, Snapchat and Moloco. Attribution is included.