ROAS Calculator: Calculate Return on Ad Spend
Use the free ROAS calculator to turn ad spend and revenue into a simple return ratio. Then use the surrounding workflow guidance to understand why ROAS alone is not enough without attribution, margin, payback, and cohort context.
Enter Your Numbers
ROAS Formula
Return on Ad Spend (ROAS) measures the revenue generated for every dollar spent on advertising. A ROAS of 4x means you earn $4 for every $1 spent on ads. The same result is sometimes written as a percentage — 4x and 400% describe the identical outcome.
Example: If you spend $1,000 on ads and generate $4,000 in revenue, your ROAS is 4x (or 400%).
Industry ROAS Benchmarks
| Industry | Average ROAS | Status |
|---|---|---|
| E-commerce (General) | 4x | |
| Fashion & Apparel | 4.5x | |
| Electronics | 3.5x | |
| SaaS / Software | 5x | |
| Mobile Apps / Gaming | 2.5x | |
| Finance / Insurance | 6x | |
| Travel & Tourism | 3x | |
| Health & Beauty | 4x |
* Benchmarks are industry averages and may vary by margin, business model, and attribution setup.
How to Improve Your ROAS
What is a ROAS calculator?
A ROAS calculator divides campaign revenue by the ad spend behind it and returns a multiple.
- $6,000 of revenue on $2,000 of spend is a ROAS of 3x
- Break-even ROAS moves with product margin
- One team can scale at 2x where another cannot
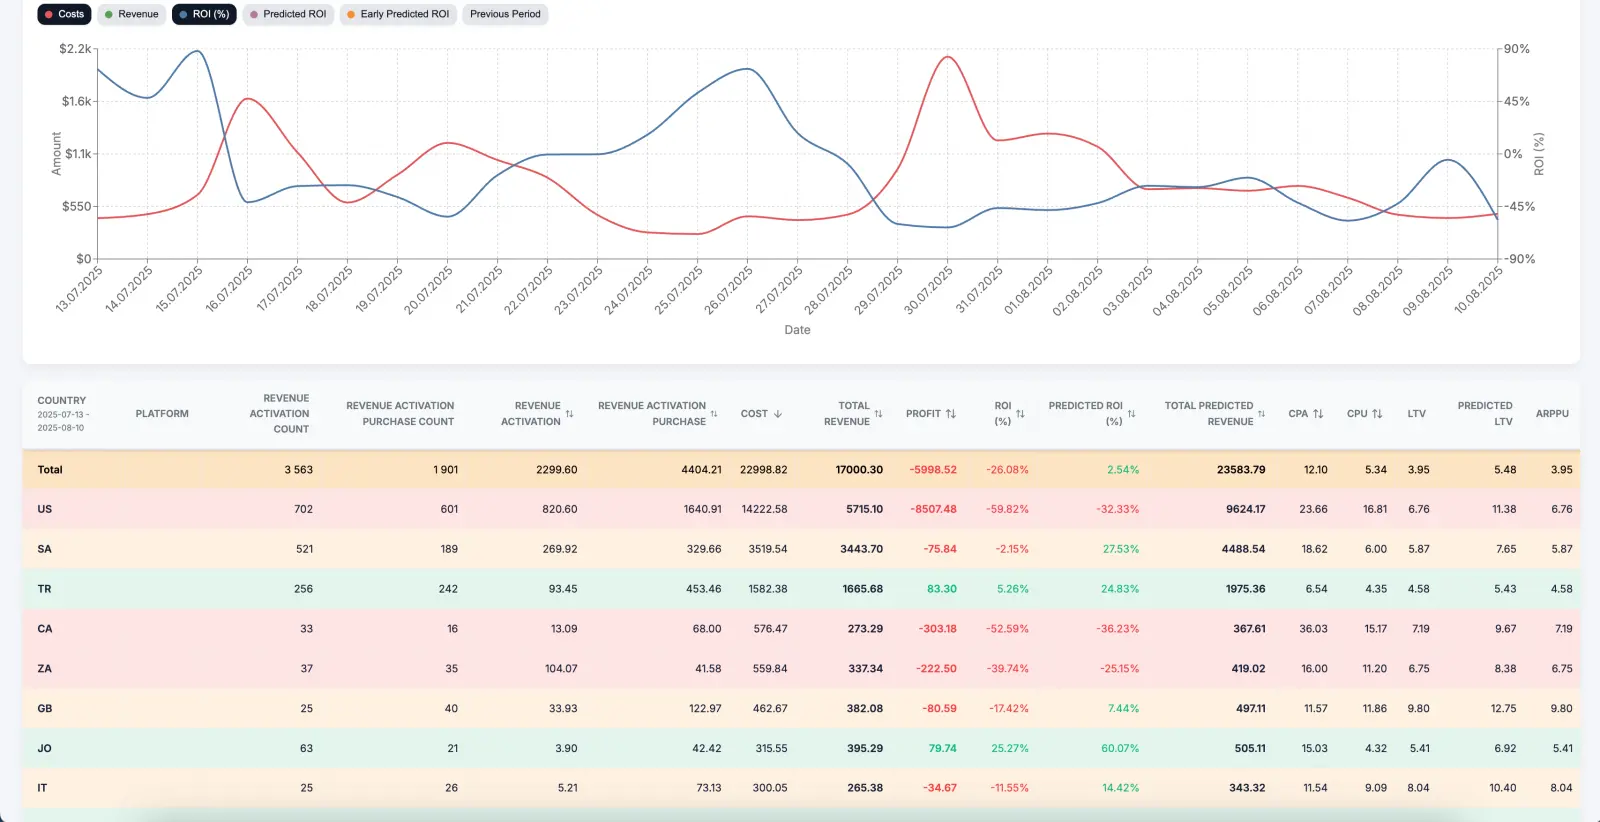
- Inside AdBid it is read beside attribution, payback and LTV
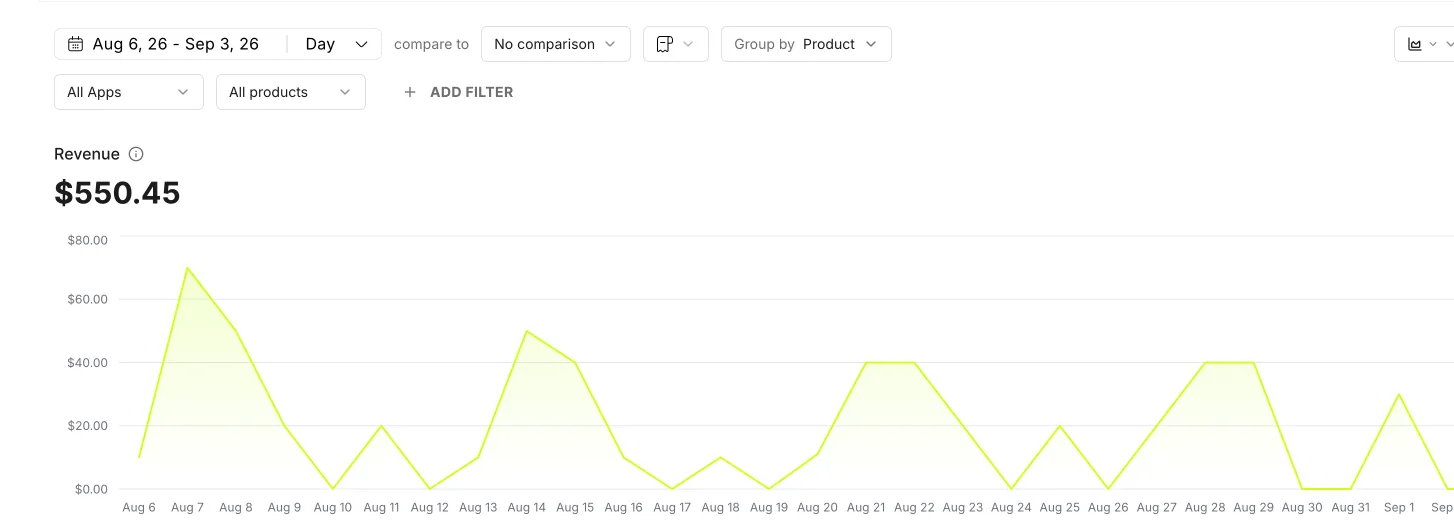
ROAS is a signal, not the whole answer
The ROAS formula, and what each input has to mean
ROAS = revenue attributed to the campaign ÷ ad spend behind it.
- $6,000 revenue ÷ $2,000 spend = 3x
- Use attributed revenue, not total store revenue
- Use the same window for revenue and for spend
- Break-even ROAS = 1 ÷ gross margin

A ROAS calculator is a signal, not the whole answer
A ROAS number is useful when it is connected to the business model.
- Compare revenue against ad spend.
- Review profit and margin context.
- Use attribution to confirm which campaign produced the value.
Read return through margin and payback
The same ROAS can mean different budget decisions.
- Add gross-margin context before calling a campaign profitable.
- Compare short attribution windows with cohort payback.
- Use LTV assumptions carefully when cohorts are still maturing.
Get started in 5 steps
Enter the campaign inputs
Spend, impressions, clicks or revenue — the calculator solves for the rest.
Read the result beside its neighbours
A metric on its own misleads; pair it with CTR, conversion rate and revenue.
Check it against the benchmarks
Industry averages on the page are orientation, not targets.
Connect an account for live numbers
The same metrics, computed from real spend and revenue instead of estimates.
Let attribution replace the estimates
ROAS, CPA and LTV are read against real paying users from then on.