Key Takeaways
- ROI is named the top metric by nearly 1 in 5 marketers (Adobe), yet just 34% track it consistently (Adobe).
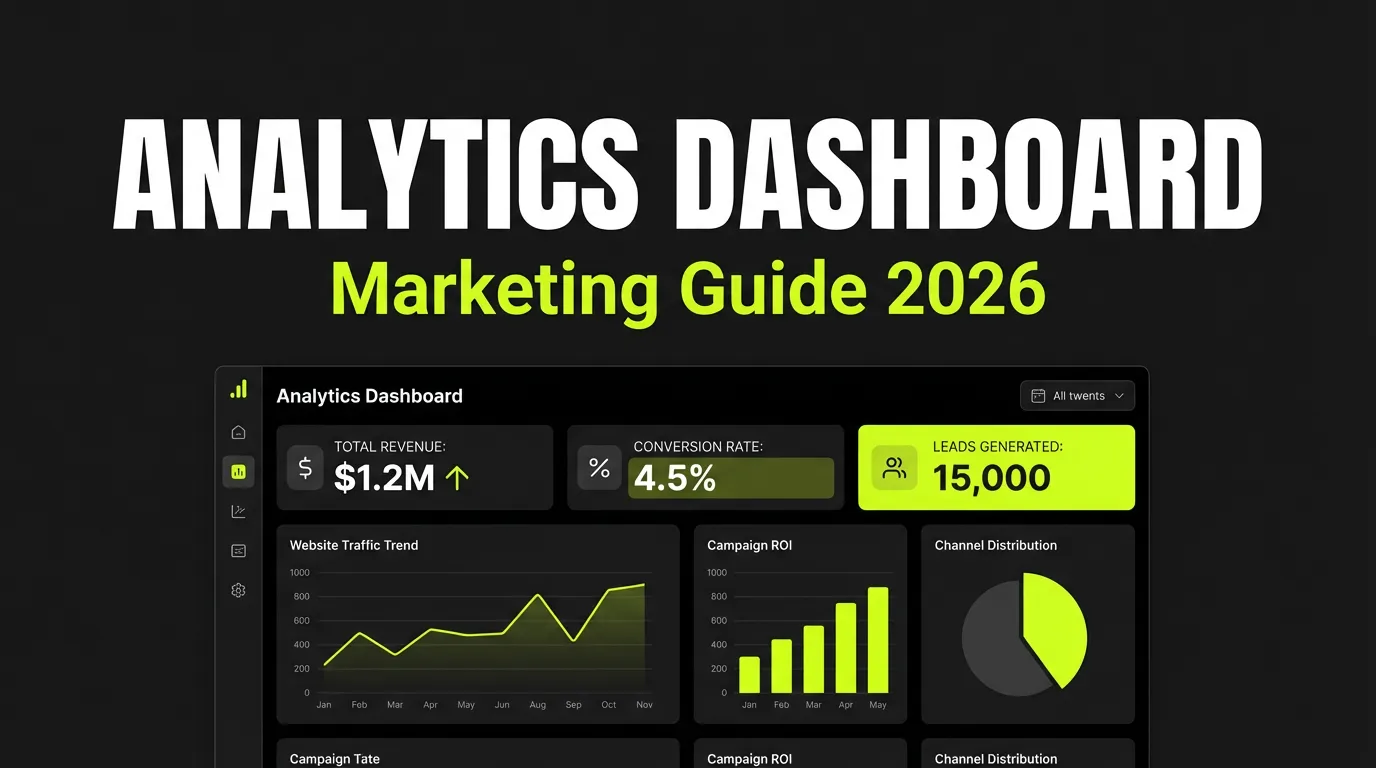
- A 2026-ready analytics dashboard answers three questions: what's working, where to invest, and whether you're improving.
- Multi-touch attribution has replaced last-click as the baseline for credit assignment.
- Build separate views for executives, managers, and analysts instead of one shared screen.
- AI-generated content performance is the emerging metric category teams now track alongside ROAS.
What Makes a Marketing Analytics Dashboard Different in 2026?
ROI is named the top metric by nearly 1 in 5 marketers (Adobe), but only 34% track it consistently (Adobe). That gap defines the modern dashboard problem. Teams have more data than ever, yet measurement discipline lags behind. The fix is structure, not more charts.
A dashboard is a decision tool, not a data archive. Every panel should map to an action you can actually take. If a metric doesn't change a budget, a bid, or a creative, it's reporting overhead.
Ask whether your current screen answers three questions clearly. What's working right now? Where should the next dollar go? Are results trending up or down? When the answers aren't obvious in seconds, the dashboard has become noise.
This guide focuses on analytics depth: attribution logic, audience-specific views, and the metrics that survive scrutiny. For a broader build walkthrough, see our marketing dashboard guide.
Which KPIs Actually Matter This Year?
Marketers rank brand awareness as their most valuable metric, even though it remains the hardest to measure (Adobe). That tension shapes every KPI choice. The most valuable numbers are often the most difficult, so teams default to easy vanity metrics instead. Resist that pull.
Top Metrics by Value
According to Adobe's research, marketers rank these metrics as most valuable:
| Rank | Metric | Why It's Hard |
|---|---|---|
| 1 | Brand Awareness | Difficult to attribute to revenue |
| 2 | ROI / ROAS | Attribution complexity |
| 3 | Customer Acquisition Cost | Needs channel-level clarity |
| 4 | Conversion Rate | Varies by funnel stage |
| 5 | Customer Lifetime Value | Requires time to mature |
The Three-Layer KPI Framework
Group metrics by the question they answer, not by the platform they come from. This keeps the dashboard readable even as channels multiply.
Acquisition: Customer Acquisition Cost (CAC), Cost Per Lead (CPL), Marketing Qualified Leads (MQLs), and Lead Velocity Rate. These tell you whether the top of the funnel is healthy.
Conversion: Conversion rate by stage, pipeline value, sales cycle length, and win rate. These reveal where momentum stalls between interest and revenue.
Revenue: Marketing-attributed revenue, Return on Ad Spend (ROAS), Customer Lifetime Value (CLV), and revenue per user. These prove marketing's contribution to the business.
Pick five to seven that fit your model. For deeper context on connecting these signals to strategy, our data-driven marketing guide walks through the operating rhythm around them.
Why Has Last-Click Attribution Stopped Working?
Last-click attribution credits the final touchpoint with 100% of the conversion, which badly misrepresents how buyers actually decide. As Adobe notes, with users bouncing between social, search, email, and ads, tracking true influence across channels has never been harder, or more important (Adobe). The single-touch model simply can't see that complexity.
Consider a realistic path. A buyer sees an Instagram ad and ignores it. They watch a YouTube video later, still no action. Then they search a branded term, click a Google ad, and browse. A retargeting email lands. Finally, a direct visit ends in purchase.
Last-click hands Google all the credit. Reality says every step contributed. Reward only the closer and you'll defund the channels that opened the door.
Multi-Touch Attribution Models
| Model | Logic | Best For |
|---|---|---|
| Linear | Equal credit to every touchpoint | Balanced, simple reporting |
| Time Decay | More credit to recent touches | Short sales cycles |
| Position-Based | 40% first, 40% last, 20% middle | Awareness plus conversion focus |
| Data-Driven | Machine learning assigns credit | High volume, mature teams |
There's no universally correct model. Match it to your sales cycle and data volume. For a model-by-model breakdown with implementation steps, read our attribution modeling guide.
How Should You Structure Dashboards for Different Audiences?
A CMO and a media analyst need entirely different views of the same data, which is why one-size-fits-all dashboards fail. Brand awareness ranks as the most valued metric overall (Adobe), but an analyst optimizing bids needs placement-level detail, not boardroom summaries. Separate the tiers and each role gets signal instead of clutter.
Tier 1: Executive View
For CMOs, CEOs, and stakeholders. It shows marketing's bottom-line impact in a glance: total revenue attributed to marketing, overall ROI and ROAS, CAC trend over time, marketing-sourced pipeline, and year-over-year comparisons. Keep it to a single screen.
Tier 2: Manager View
For channel and campaign managers. This view drives weekly decisions: channel-level ROI, campaign performance, budget pacing, optimization opportunities, and A/B test results. It's where most budget reallocation actually happens.
Tier 3: Analyst View
For deep-dive optimization. Granular and dense by design: audience segment performance, creative performance, placement analysis, cohort views, and custom attribution comparisons. Analysts tolerate complexity because it's where the real tuning lives.
How Do You Build the Dashboard?
Most dashboard projects fail on scope, not tooling, so define the decisions first. With only 34% of marketers tracking ROI consistently (Adobe), the priority is reliable measurement of a few metrics, not visual polish across dozens. Start narrow and expand once the data is trustworthy.
Step 1: Define the Decisions
Write down what this dashboard will inform: budget allocation, channel optimization, campaign planning, performance reviews, or executive reporting. Each decision pulls in a specific metric. If a chart serves no listed decision, cut it.
Step 2: Connect Your Data Sources
| Source | Data Type | Integration |
|---|---|---|
| Google Analytics 4 | Website behavior | Native |
| Meta Ads | Paid social | API |
| Google Ads | Paid search | API |
| CRM (Salesforce, HubSpot) | Revenue, leads | API |
| Email platform | Email performance | API |
| E-commerce platform | Sales data | API |
Step 3: Pick a Tool
| Tool | Best For | Relative Cost |
|---|---|---|
| Google Looker Studio | GA4 integration, free tier | Free |
| Tableau | Advanced visualization | High |
| Power BI | Microsoft ecosystem | Medium |
| Databox | Pre-built integrations | Low |
The tool matters less than the data hygiene behind it. A clean Looker Studio board beats a messy enterprise stack every time.
Which Formulas Should Anchor Your Reporting?
Three formulas carry most of the weight in a marketing dashboard, and getting them right separates measurement from guesswork. Since ROI tracking remains inconsistent across the industry (Adobe), standardizing these calculations is a competitive advantage on its own. Define them once, document them, and apply them everywhere.
Customer Acquisition Cost (CAC)
CAC = Total Marketing Spend / New Customers Acquired. Include ad spend, marketing tools, agency fees, content production, and optionally team salaries. The "optional" line drives most disagreement, so decide your rule and keep it consistent across reports.
Marketing-Attributed Revenue
Revenue from customers who touched marketing, multiplied by attribution weight. This is the strongest proof of marketing's value, and it depends entirely on a sound attribution setup. Garbage attribution produces convincing but false revenue claims.
Lead Velocity Rate (LVR)
LVR = (Qualified Leads This Month - Qualified Leads Last Month) / Qualified Leads Last Month x 100. It measures month-over-month growth in qualified leads as a leading indicator that predicts future revenue. Watch it when you want early warning, not a lagging scorecard.
For how these metrics feed paid-channel scaling, see our performance marketing guide.
What Mistakes Sink Most Dashboards?
The most common dashboard failures are self-inflicted, and they repeat across teams of every size. Because many marketers still chase easy-to-measure vanity numbers over harder revenue metrics (Adobe), the core mistakes cluster around focus and context. Avoid these four and you're ahead of most peers.
Too many metrics. More data does not equal better decisions. Cap the view at five to seven KPIs that genuinely drive action.
No context. A number alone is meaningless. Always show it against target, against the prior period, and against a benchmark.
Vanity-metric focus. Impressions and follower counts don't pay invoices. Tie every panel back to a business outcome.
Siloed data. Marketing data divorced from sales data hides the full picture. Integrate your CRM with your ad platforms so attribution stays honest.
Frequently Asked Questions
What is the difference between a marketing dashboard and marketing analytics?
A marketing dashboard is the visual surface that displays metrics, while marketing analytics is the underlying practice of collecting, modeling, and interpreting that data. The dashboard shows what happened; analytics explains why and what to do next. With only 34% of marketers tracking ROI consistently (Adobe), strong analytics is what makes a dashboard trustworthy.
How many KPIs should a marketing dashboard track?
Most teams should track five to seven KPIs per view, focused on metrics tied to real decisions. Brand awareness ranks as the most valued metric despite being the hardest to measure (Adobe), so balance high-value goals with metrics you can act on. Adding more panels usually reduces clarity rather than improving it.
Is last-click attribution still useful in 2026?
Last-click attribution is no longer reliable as a primary model because buyers move across social, search, email, and ads before converting (Adobe). It can still serve as a simple sanity check, but multi-touch or data-driven models give a far more honest view of channel contribution. Our attribution modeling guide compares the options in detail.
Which marketing analytics metric proves value to executives fastest?
Marketing-attributed revenue is the fastest way to prove value to executives because it connects activity directly to money. ROI is the top metric named by nearly 1 in 5 marketers (Adobe), and pairing attributed revenue with ROAS turns marketing from a cost center into a measurable growth engine in the boardroom.
The Bottom Line
A marketing analytics dashboard earns its place only when it changes decisions. The strongest teams ignore vanity metrics, adopt multi-touch attribution, and tailor views to executives, managers, and analysts separately. They automate reporting so people spend their time on analysis, and they refine metrics as the business shifts.
Start with three numbers you can trust: CAC, marketing-attributed revenue, and ROAS. Track those accurately across channels and you've already built a stronger foundation than most. With ROI tracking still inconsistent industry-wide (Adobe), measurement discipline is the real edge in 2026.
Ready to unify attribution and reporting across Meta, Google, and TikTok in one place? Explore the AI Agents Ads Manager and see your complete picture without switching tabs.