Key Takeaways
:::highlight The Frequency Sweet Spot Research shows 80% of advertising impact occurs in the first 2 exposures per week. After 10+ exposures, negative brand sentiment increases by 16%. The goal isn't maximum impressions—it's optimal impressions. :::
- More isn't always better — After optimal frequency, each additional exposure decreases ROI
- Frequency varies by objective — Brand awareness needs higher frequency than direct response
- Cross-platform matters — Users see your ads across multiple platforms; total exposure is what counts
- Frequency caps improve efficiency — Proper caps can reduce CPM 10-20% while maintaining results
- Ad fatigue is real — CTR typically drops 50% after 5-8 exposures to same creative
Once you're ready to scale, AdBid gives you the workflow to plan, launch, and optimize without adding headcount.
What Is Frequency Capping?
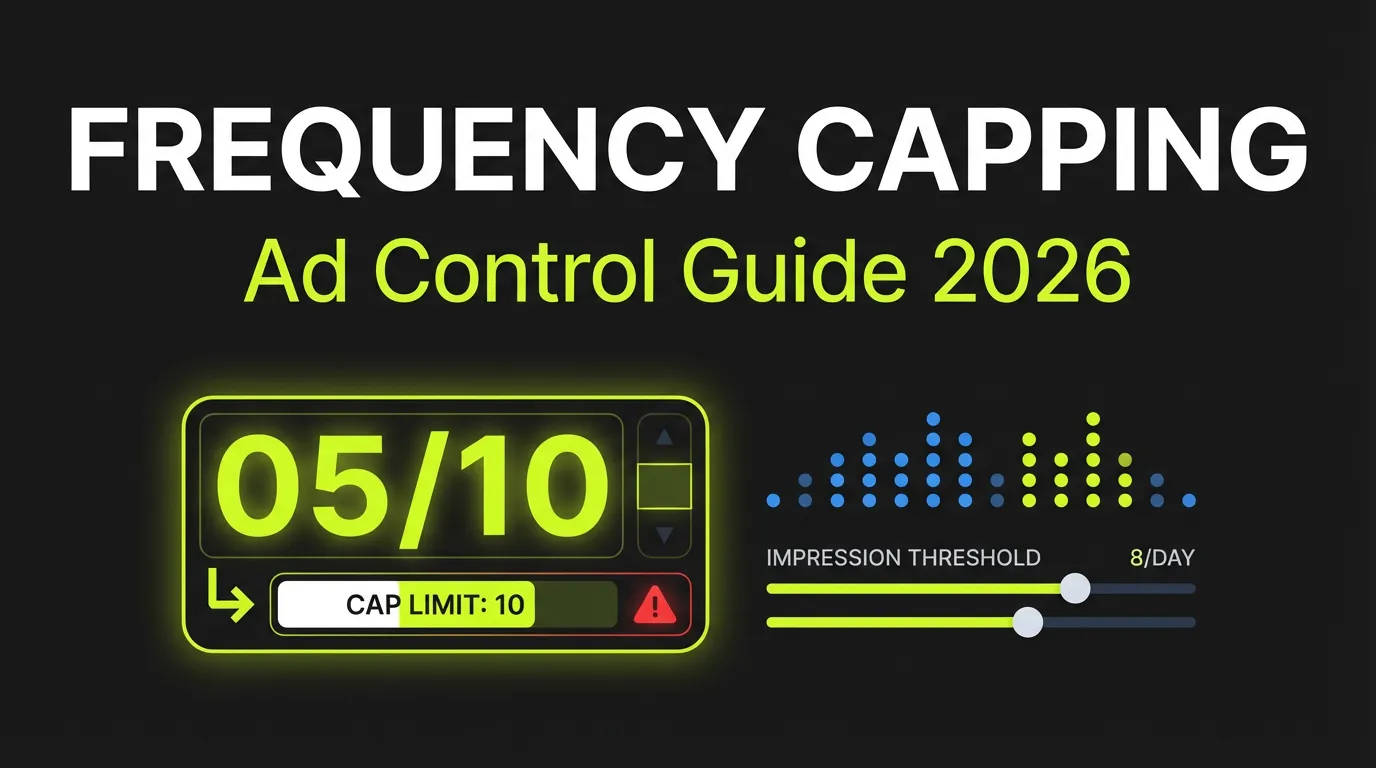
Frequency capping limits how many times a single user sees your ad within a defined time period.
:::info Frequency Definitions Frequency = Total impressions / Unique reach
Frequency Cap = Maximum impressions per user per time period
Effective Frequency = Number of exposures needed to achieve advertising objective :::
Why Frequency Matters
| Too Low Frequency | Optimal Frequency | Too High Frequency |
|---|---|---|
| Insufficient recall | Maximum impact | Wasted impressions |
| Low conversion | Efficient spend | Negative sentiment |
| Weak brand lift | Brand building | Ad blindness |
| Below threshold | Peak performance | Diminishing returns |
The Science of Ad Frequency
Decades of research inform optimal frequency strategies.
The Exposure-Response Curve
Ad effectiveness follows a predictable pattern:
Effectiveness
    ^
    |      Optimal zone
    |    /‾‾‾‾‾‾‾‾‾\
    |   /           \
    |  /             \  Diminishing returns
    | /               \___________
    |/
    +---------------------------------> Exposures
    0   2   4   6   8   10   12+
Key findings:
- First exposure: 30-40% of total response
- Second exposure: 20-25% additional response
- Third exposure: 10-15% additional response
- Beyond 6-8: Minimal positive impact
- Beyond 10-12: Potential negative impact
:::warning The Frequency Trap Many advertisers assume more frequency = more results. Data shows the opposite. After 6-8 exposures per week, additional impressions typically have negative marginal ROI. :::
Research Benchmarks
| Source | Optimal Frequency | Time Period |
|---|---|---|
| Meta Internal Study | 1-2 per week | Weekly |
| Nielsen | 5-9 total | Campaign |
| Kantar | 3-5 per week | Weekly |
| comScore | 7-10 total | Monthly |
| 2-3 per week | Weekly |
"There's no universal 'right' frequency. But there's definitely 'wrong' frequency—and it's almost always higher than advertisers think."
Setting Frequency Caps by Objective
Different goals require different frequency strategies.
Brand Awareness Campaigns
Goal: Maximize recall and recognition
| Metric | Recommended Cap |
|---|---|
| Weekly cap | 3-5 impressions |
| Monthly cap | 12-20 impressions |
| Campaign cap | Varies by duration |
Rationale: Brand building requires repetition, but oversaturation damages brand perception.
:::tip Brand Frequency For new brands, lean toward higher frequency (4-5/week). For established brands, lower frequency (2-3/week) maintains presence without wearing out welcome. :::
Direct Response Campaigns
Goal: Drive immediate action (purchase, sign-up, lead)
| Metric | Recommended Cap |
|---|---|
| Daily cap | 2-3 impressions |
| Weekly cap | 5-8 impressions |
| Post-conversion | 0 (exclude converters) |
Rationale: DR campaigns need urgency without harassment. If someone hasn't converted after 8 exposures, more ads won't change their mind—they need different creative or offer.
Retargeting Campaigns
Goal: Re-engage interested users
| Metric | Recommended Cap |
|---|---|
| Daily cap | 1-2 impressions |
| Weekly cap | 5-7 impressions |
| Recency window | 7-30 days |
:::warning Retargeting Danger Zone Retargeting without frequency caps is the fastest way to annoy potential customers. 52% of consumers report feeling "stalked" by retargeting ads. :::
Platform-Specific Frequency Settings
Meta Ads (Facebook/Instagram)
Available controls:
- Reach and Frequency buying: Guaranteed frequency control
- Auction buying: Frequency caps at ad set level
- Account-level frequency: Limits across campaigns
Settings:
- Go to Ad Set → Optimization & Delivery
- Click "Show more options"
- Set frequency cap (1 impression every X days)
Limitations:
- Minimum 1 impression per 6 hours
- Caps may limit reach on small audiences
- Learning phase may override caps
Google Ads
Display & Video Frequency:
- Impression caps: Per day, week, month
- View caps: For video specifically
Settings:
- Campaign → Settings → Additional settings
- Frequency capping section
- Set cap for impressions per user
:::info Google Frequency Google's default is no cap (unlimited). Always set manual caps for display and video campaigns—unlimited frequency wastes budget on over-exposed users. :::
Programmatic (DSP)
Advanced controls:
- Cross-device frequency
- Cross-publisher frequency
- Time-based decay
- Dynamic caps based on engagement
Setup varies by DSP (DV360, The Trade Desk, Amazon DSP, etc.)
Connected TV
CTV frequency considerations:
- Household-level capping (vs individual)
- Multi-viewer environments
- Longer ad pods allow higher frequency
- Co-viewing increases effective reach
Typical CTV caps: 3-5 impressions per household per week
Cross-Platform Frequency Management
Users see your ads across multiple platforms. Total exposure matters.
The Hidden Frequency Problem
User sees your ad:
- Meta: 4 times
- Google Display: 3 times
- YouTube: 2 times
- Programmatic: 3 times
- CTV: 2 times
------------------------
Total: 14 times per week

Each platform reports "normal" frequency.
Combined, it's excessive.
:::highlight Cross-Platform Reality 44% of advertisers don't coordinate frequency across platforms. These advertisers over-expose audiences by an average of 3x their intended frequency. :::
Solutions for Cross-Platform Coordination
1. Identity graphs:
- Use identity solutions (LiveRamp, Unified ID 2.0)
- Match users across platforms
- Cap at identity level, not platform level
2. Media mix modeling:
- Measure optimal total frequency
- Allocate impressions across platforms
- Reduce in over-represented channels
3. Clean rooms:
- Match platform data in privacy-safe environment
- Identify cross-platform overlap
- Optimize allocation
4. Manual coordination:
- Set conservative caps per platform
- Assume 20-40% audience overlap
- Total caps = sum of platform caps × overlap factor
Frequency vs Reach Trade-offs
You can reach more people fewer times or fewer people more times.
The Reach-Frequency Balance
With fixed budget:
| Strategy | Reach | Frequency | Best For |
|---|---|---|---|
| Broad | 1M people | 3x each | New products, awareness |
| Medium | 500K people | 6x each | Consideration, mid-funnel |
| Narrow | 200K people | 15x each | Retargeting, hot audiences |
:::tip Budget Allocation As a starting point, allocate budget to achieve 70% of your target audience at optimal frequency before expanding reach to new users. :::
When to Prioritize Reach
- New brand launch
- Category expansion
- Seasonal campaigns
- Market share growth
When to Prioritize Frequency
- Retargeting converters
- Complex product education
- Competitive conquest
- Limited high-value audience
Detecting and Preventing Ad Fatigue
Ad fatigue is when audiences tire of seeing the same creative.
Signs of Ad Fatigue
| Metric | Fatigue Indicator |
|---|---|
| CTR | Declining 10%+ week over week |
| CPC | Increasing while CTR drops |
| Frequency | Rising above benchmarks |
| Engagement | Comments turn negative |
| Conversion rate | Dropping despite stable traffic |
The Fatigue Timeline
Exposures 1-2:  Fresh, engaging
Exposures 3-5:  Peak effectiveness
Exposures 6-8:  Beginning fatigue
Exposures 9-12: Significant fatigue
Exposures 13+: Active avoidance/annoyance
:::warning Creative Lifespan The average creative reaches fatigue point (50% CTR decline) after:
- Static image: 3-4 weeks
- Carousel: 4-6 weeks
- Video: 6-8 weeks
- UGC: 2-3 weeks (novelty wears fast) :::
Combating Ad Fatigue
1. Creative rotation:
- Minimum 3-5 variations per ad set
- Auto-rotate based on performance
- Refresh creative every 2-4 weeks
2. Sequential messaging:
- Show different messages in sequence
- Build narrative over exposures
- Each ad advances the story
3. Format variation:
- Mix static, video, carousel
- Different formats feel like different ads
- Reduces perceived repetition
4. Audience refresh:
- Exclude high-frequency users
- Expand to new lookalikes
- Rotate audience segments
Advanced Frequency Strategies
Dynamic Frequency Capping
Adjust caps based on user behavior:
If user engaged (clicked, watched):
  → Continue showing ads (higher cap)

If user ignored multiple times:
  → Reduce frequency (lower cap)

If user showed negative signal:
  → Stop showing (exclude)
Recency-Based Capping
Vary frequency by how recently user took action:
| Days Since Visit | Frequency Cap |
|---|---|
| 0-3 days | 3/day |
| 4-7 days | 2/day |
| 8-14 days | 1/day |
| 15-30 days | 3/week |
| 31+ days | 1/week |
Journey-Based Frequency
Different frequency by funnel stage:
Awareness: 2-3 exposures → Move to consideration
Consideration: 4-6 exposures → Move to decision
Decision: 3-5 exposures → Convert or exclude
Post-purchase: 1-2/week → Retention messaging
Measuring Frequency Impact
How to know if your frequency strategy works.
Frequency-Performance Analysis
Create frequency cohorts:
| Frequency Bucket | Conversion Rate | CPA |
|---|---|---|
| 1-2 exposures | 1.2% | $45 |
| 3-5 exposures | 1.8% | $38 |
| 6-8 exposures | 1.6% | $42 |
| 9-12 exposures | 1.1% | $55 |
| 13+ exposures | 0.6% | $89 |
This reveals your optimal frequency zone.
:::tip Frequency Sweet Spot In the example above, 3-5 exposures is the sweet spot. Exposures 1-2 haven't built enough consideration. Beyond 8, you're wasting money. :::
Brand Lift by Frequency
Measure brand metrics at different frequency levels:
| Metric | Lift at 3x | Lift at 6x | Lift at 10x |
|---|---|---|---|
| Awareness | +8% | +12% | +13% |
| Consideration | +5% | +9% | +8% |
| Favorability | +3% | +5% | +2% |
| Intent | +4% | +6% | +4% |
Note how lift plateaus or decreases after optimal point.
Common Frequency Mistakes
1. No Caps at All
"We'll let the algorithm optimize"
Reality: Without caps, algorithms serve to whoever converts easiest—often the same people repeatedly. This over-exposes engaged users while under-reaching new ones.
2. Same Cap for All Campaigns
"We use 5/week across everything"
Reality: Different objectives, audiences, and creatives need different caps. Retargeting needs lower caps than prospecting.
3. Platform-Only Thinking
"Each platform is capped appropriately"
Reality: Users exist across platforms. Platform-level caps don't prevent cross-platform over-exposure.
4. Ignoring Creative Fatigue
"Our frequency is fine, we check it"
Reality: Even with good frequency, showing the SAME ad repeatedly causes fatigue. Rotate creative to refresh without increasing frequency.
5. Forgetting Post-Conversion
"We exclude purchasers from acquisition"
Reality: Don't forget to exclude from ALL campaigns. Post-conversion over-exposure damages brand perception and wastes budget.
The Bottom Line
Frequency capping is about efficiency, not restriction:
- Set caps based on objective — Brand awareness tolerates higher frequency than direct response
- Coordinate across platforms — Total exposure matters, not just per-platform
- Match cap to funnel stage — Different frequency needs at awareness vs conversion
- Monitor for fatigue — Declining CTR + rising frequency = time to refresh
- Test your optimal point — Analyze performance by frequency cohort
- Rotate creative regularly — Same ad at any frequency eventually fatigues
:::tip The Frequency Mindset "Frequency capping isn't about showing fewer ads. It's about showing the right number of ads to each person—and not one more." :::
"The advertiser who reaches 100 people 5 times each will almost always outperform the one who reaches 50 people 10 times each. More efficient reach beats repetitive saturation."
AdBid helps you monitor frequency across platforms and campaigns. See where you're over or under-exposing your audiences. Start your frequency analysis.