Conversion Rate Optimization in 2026: Turning Paid Clicks Into Customers
Most advertisers obsess over cost per click while ignoring the bigger lever. Conversion rate optimization, the practice of increasing the share of visitors who complete a goal, often delivers more profit than any bidding tweak. The average e-commerce conversion rate sits between 2% and 4% (Shopify, 2024). Closing even part of that gap reshapes your entire unit economics.
This guide focuses on something narrower than a general CRO playbook. We look at how conversion optimization connects to paid acquisition, where the money flows in and every wasted click costs you twice.
Key Takeaways
- CRO compounds with paid media: doubling conversion rate halves your effective cost per acquisition without new budget.
- Roughly 70% of online shopping carts get abandoned (Baymard Institute, 2024), making checkout the highest-value place to optimize.
- Match ad message to landing page, because mismatched intent is the quietest conversion killer.
- Test one variable at a time and wait for statistical significance before declaring a winner.
Why Does CRO Matter More for Paid Traffic?
Paid traffic raises the stakes because every visitor has a price tag. When you buy clicks, a low conversion rate means you are paying full freight for people who leave empty-handed. Organic traffic forgives a weak page. Paid traffic punishes it. That is why conversion optimization and media buying belong in the same conversation, not separate teams.
Consider the arithmetic. Imagine $10,000 in ad spend driving 10,000 visitors. At a 1% conversion rate you acquire 100 customers, so your cost per acquisition is $100. Lift conversion to 2% and the same spend yields 200 customers at $50 each. You did not touch your bids. You changed what happened after the click.
This relationship is why CRO often outperforms further bid optimization once campaigns mature. There is a ceiling on how cheap clicks can get in a competitive auction. There is far more room to improve what those clicks do once they arrive. For the broader strategic picture across the funnel, our complete conversion rate optimization guide walks through the full measurement framework.
The Cost of Ignoring It
Ignoring conversion rate means scaling waste. If you double your ad budget on a page that converts poorly, you double the number of expensive visitors who bounce. Growth amplifies whatever rate you already have, good or bad. Fix the rate first, then pour fuel on the fire.
How Do You Find Where Conversions Leak?
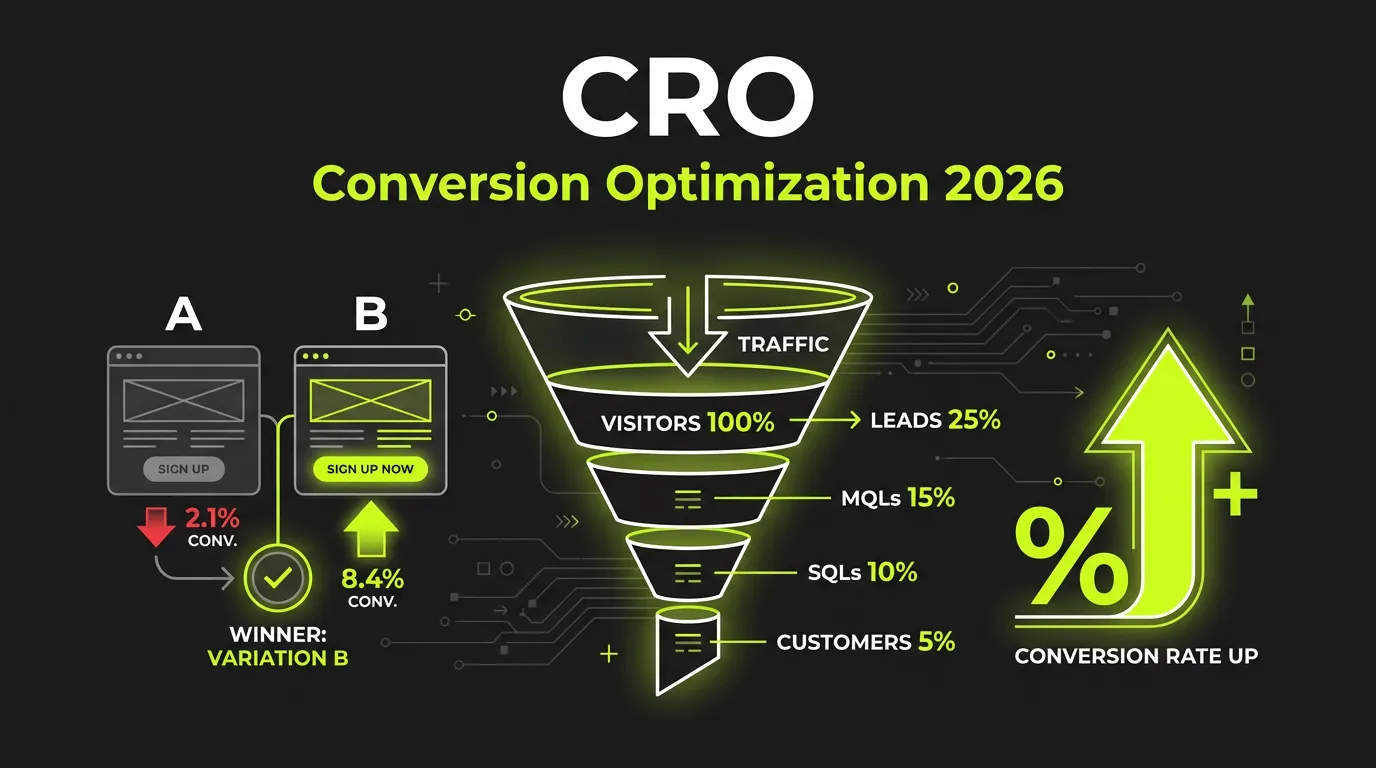
Start with the funnel, because aggregate conversion rate hides where the real losses happen. Break the journey into stages: ad click, landing page view, add to cart, checkout start, purchase. Cart abandonment alone runs near 70% across e-commerce (Baymard Institute, 2024). When you see the drop-off per stage, you stop guessing and start fixing the worst step first.
Quantitative tools tell you where people leave. Google Analytics 4 funnel reports show drop-off between steps. Qualitative tools tell you why. Session recordings and heatmaps from platforms like Hotjar or Microsoft Clarity reveal rage clicks, ignored buttons, and forms people abandon mid-fill. You need both halves. Numbers without context lead to bad guesses.
Here is a rhetorical question worth asking your own data: at which exact step do you lose the most paid visitors? Most teams cannot answer precisely, and that gap is where the money hides.
A Simple Leak Audit
Run this in an afternoon. Pull your funnel report for the last 30 days. Identify the single step with the steepest percentage drop. Watch ten session recordings of users who failed at that step. Write down every point of friction you observe. This narrow exercise consistently surfaces fixable problems faster than a sprawling site-wide audit.
What Actually Moves Conversion Rate?
Message match moves the needle more than most teams expect. When an ad promises one thing and the landing page shows another, visitors feel the disconnect and leave within seconds. Page speed matters too: a one-second delay in load time can meaningfully reduce conversions (Google/Deloitte, 2019). These two factors decide outcomes before a visitor reads a word of your copy.
Beyond speed and relevance, a handful of changes reliably earn their keep:
- Headline and value proposition. Lead with the outcome the customer wants, stated plainly.
- Call-to-action clarity. One primary action per page, with button text that names the result.
- Form friction. Every extra field costs completions. Ask only for what you truly need.
- Trust signals. Reviews, security badges, and clear return policies reduce hesitation at the moment of decision.
- Social proof placement. Showing real customer evidence near the decision point reassures buyers who are on the fence.
Dedicated landing pages built for each campaign almost always beat sending paid traffic to a generic homepage. Our landing page optimization guide breaks down the structural elements that convert cold paid clicks.
Mobile Comes First, Not Last
Mobile is where most commerce now happens, so optimize for it first and adapt up to desktop later. Thumb-friendly buttons, mobile wallets like Apple Pay and Google Pay, and forms that trigger the right keyboard all remove small frictions that compound. Test on real devices over a cellular connection, not just a desktop browser shrunk to phone width. The two experiences differ more than people assume.
How Should You Test Changes Properly?
Test one variable at a time and wait for statistical significance, because rushed tests produce false winners. A common standard is 95% confidence with at least 100 conversions per variation, run across full business cycles to absorb day-of-week swings. Calling a test on day two, when an early lead looks exciting, is the most expensive mistake in CRO. Early leads reverse constantly.
Structure every test as a hypothesis. State it as: if we change X, then metric Y will move because of reason Z. This forces clarity about what you expect and why. When the test ends, you either confirm the logic or learn something specific, and both outcomes have value. Document the losers as carefully as the winners. Patterns across failed tests teach you about your audience.
For a deeper methodology, including sample-size math and avoiding common analysis traps, see our A/B testing guide for advertisers. And because conversion gains flow straight into acquisition efficiency, the techniques in our CPA optimization guide pair naturally with the work here.
When Not to A/B Test
Low-traffic pages do not have the volume to reach significance in a reasonable window. On those pages, a controlled experiment can run for months without a clear answer. Use qualitative research instead: user interviews, session recordings, and direct feedback. Save formal split testing for pages with enough traffic to produce trustworthy results.
How Does CRO Connect to Smarter Bidding?
CRO and bidding feed each other, since a higher conversion rate improves the signals your ad platform learns from. When more clicks convert, automated bidding gets richer data and can target similar high-intent users more accurately. A page that converts well makes your whole campaign smarter over time. The optimization is not just on-site. It propagates back into the auction.
This feedback loop is why treating CRO and media buying as one discipline pays off. Improvements on the page raise the quality of the audience the algorithm finds, which raises conversion rate further. The brands that win in 2026 close this loop deliberately rather than running the two functions in isolation. Small, compounding gains beat occasional big swings.
Frequently Asked Questions
What is a good conversion rate in 2026?
It depends heavily on industry, traffic source, and price point. E-commerce conversion rates commonly land between 2% and 4% (Shopify, 2024). Rather than chasing a universal benchmark, compare your rate against your own history and segment by channel, since paid social and search behave very differently.
How long should I run an A/B test?
Run it long enough to reach statistical significance, typically 95% confidence with at least 100 conversions per variation. In practice that means a minimum of one to two full weeks for most pages, so you capture weekday and weekend behavior. Stopping early when an exciting lead appears produces unreliable winners.
Should paid traffic go to a homepage or a landing page?
A dedicated landing page usually outperforms a homepage for paid traffic. The homepage serves many audiences and intents, which dilutes the message. A campaign-specific page matches the exact promise of your ad, reducing the disconnect that causes early bounces and lifting conversion on expensive clicks.
Does CRO help lower my cost per acquisition?
Yes, directly. Cost per acquisition equals spend divided by conversions, so raising conversion rate at the same spend lowers CPA automatically. Doubling conversion rate halves effective CPA without any change to bids or budget, which is why conversion work often beats further bid tuning once campaigns are mature.
Putting It Into Practice
Conversion rate optimization is not a one-time project. It is a loop: measure the funnel, find the worst leak, form a hypothesis, test it properly, ship the winner, and start again. Paid traffic makes every iteration more valuable, because each percentage point of lift directly reduces what you pay per customer. The math compounds quietly in your favor.
The teams pulling ahead in 2026 are not the ones with the largest budgets. They are the ones removing friction step by step and feeding those gains back into smarter acquisition. If you want to connect conversion performance to your campaigns in one place, explore the AI Agents Ads Manager to see which campaigns drive traffic that actually converts.