Key Takeaways
:::highlight The CLV Imperative Companies that optimize for CLV see 25% higher profitability than those optimizing for immediate revenue. Acquiring a customer who stays 3 years vs 6 months is worth 6x more—even at the same initial purchase value. :::
- LTV:CAC ratio determines sustainability — Target 3:1 or higher; below 1:1 means you're losing money per customer
- Not all customers are equal — Top 20% of customers typically generate 80% of lifetime value
- First purchase predicts lifetime — Discount buyers have 50% lower LTV than full-price buyers
- Payback period matters — How quickly CAC is recovered affects cash flow and growth capacity
- Platform algorithms can optimize for LTV — With proper setup, AI finds customers who stay, not just convert
For teams optimizing spend around payback quality, AdBid's predictive LTV helps connect acquisition decisions to customer value.
What Is Customer Lifetime Value?
Customer Lifetime Value (CLV or LTV) is the total revenue a customer generates over their entire relationship with your business, minus the costs to serve them.
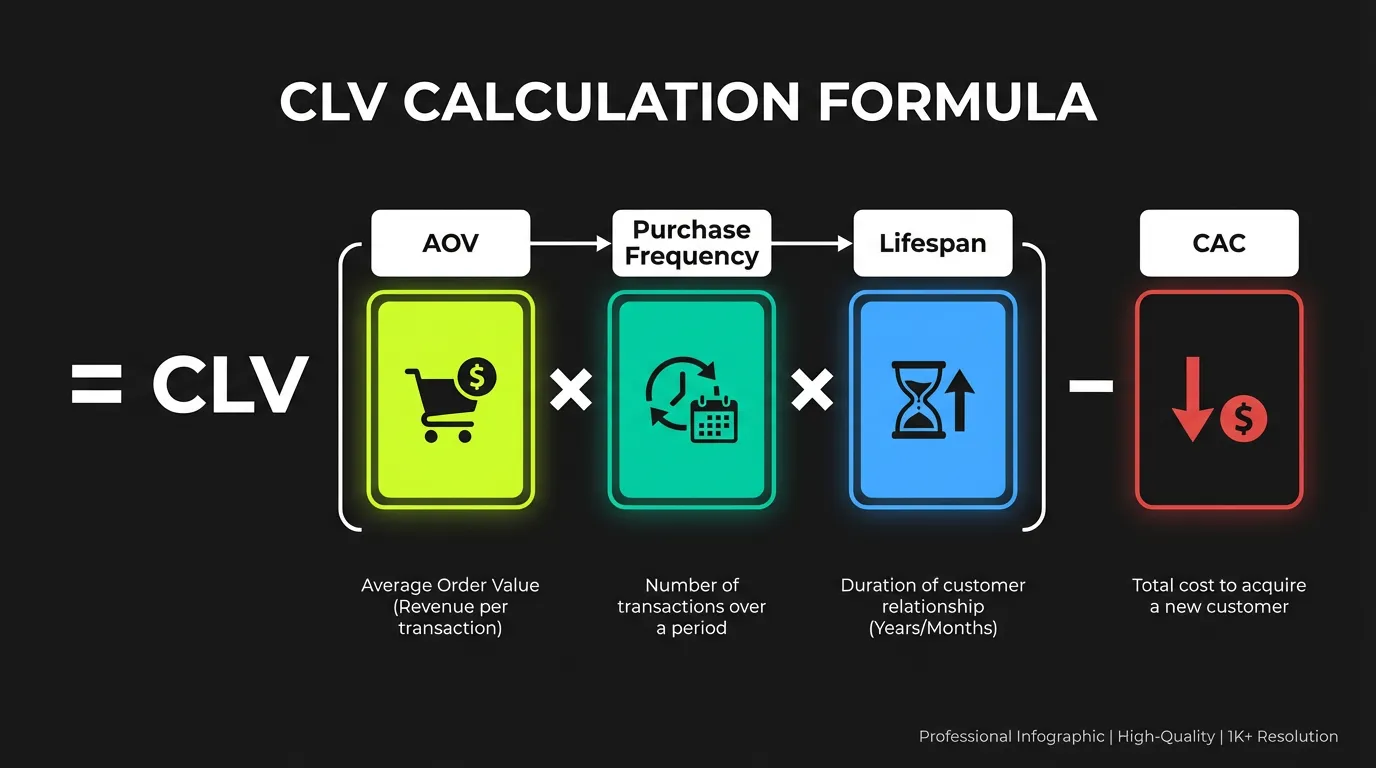
:::info Basic CLV Formula CLV = (Average Order Value × Purchase Frequency × Customer Lifespan) - Customer Acquisition Cost
Or more simply: CLV = Average Revenue Per Customer × Gross Margin × Retention Period :::
Why CLV Matters for Advertising
| Metric | What It Tells You |
|---|---|
| CLV | Total value of customer relationship |
| CAC | Cost to acquire that customer |
| LTV:CAC | Profitability of acquisition |
| Payback Period | Time to recover CAC |
| CLV by Channel | Which channels attract valuable customers |
Calculating CLV: Methods That Work
Different businesses need different CLV models.
Method 1: Historical CLV
Sum all past revenue from a customer:
Historical CLV = Total Revenue - Total Costs

Example:
Customer spent: $500 over 2 years
COGS: $200
Service costs: $50
Historical CLV: $500 - $250 = $250
Limitation: Only works for existing customers. Can't predict new customer value.
Method 2: Predictive CLV
Model future value based on behavior patterns:
Predictive CLV = (T × AOV × AGM × ALT) / Churn Rate

Where:
T = Average monthly transactions
AOV = Average order value
AGM = Average gross margin
ALT = Average customer lifespan (months)
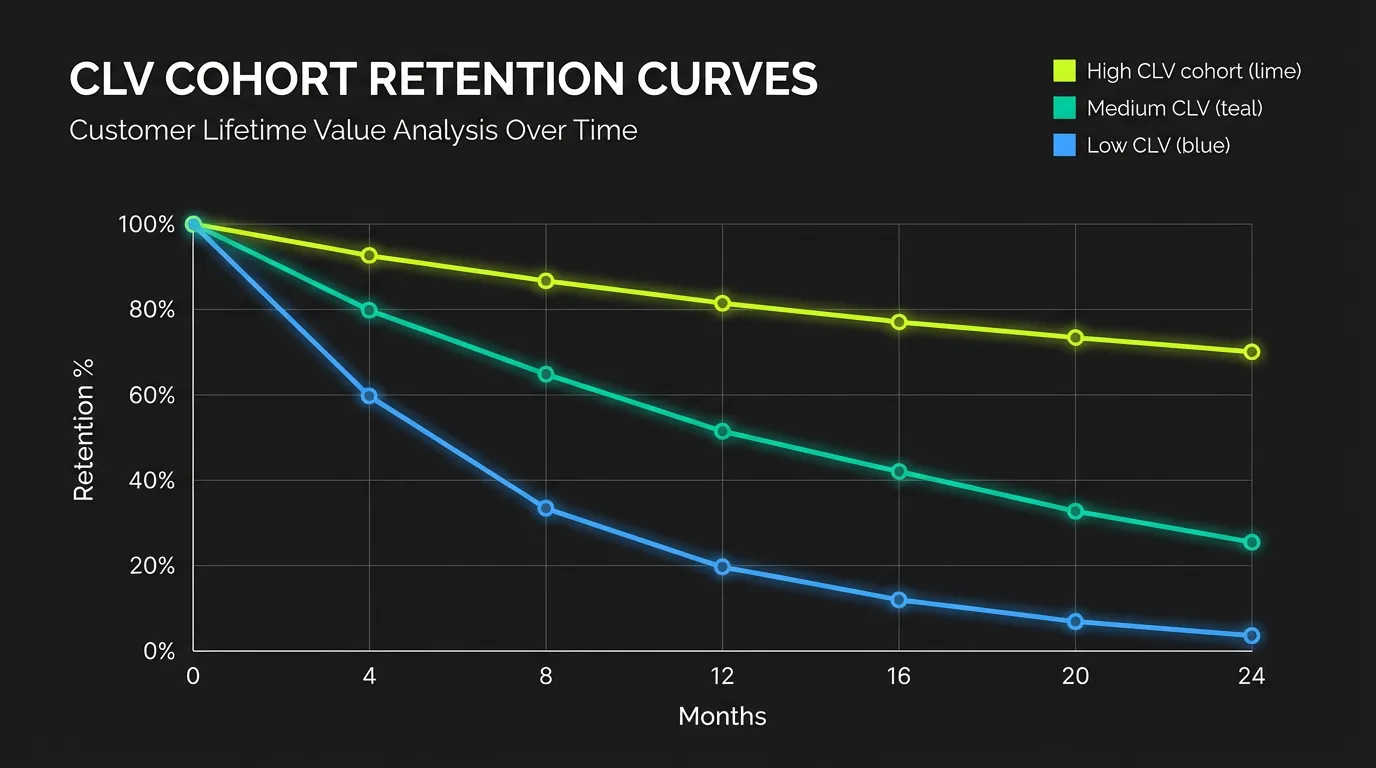
:::tip Cohort Analysis Calculate CLV by cohort (month/quarter acquired). This reveals how CLV changes over time and which acquisition periods produced the best customers. :::
Method 3: Probabilistic Models (RFM + Machine Learning)
Advanced models using:
- Recency — How recently customer purchased
- Frequency — How often they purchase
- Monetary — How much they spend
These inputs feed ML models that predict future purchase probability and value.
Method 4: Segment-Based CLV
Different customer types have different values:
| Segment | Average CLV | % of Customers |
|---|---|---|
| Premium | $2,500 | 10% |
| Regular | $800 | 50% |
| Discount | $200 | 30% |
| One-time | $50 | 10% |
The LTV:CAC Ratio
The most important metric for sustainable growth.
What Good Looks Like
| LTV:CAC | Interpretation |
|---|---|
| <1:1 | Losing money per customer |
| 1:1 - 2:1 | Marginally profitable, needs improvement |
| 3:1 | Healthy, sustainable growth |
| 5:1+ | Strong unit economics OR underinvesting in growth |
:::warning Common Mistake An LTV:CAC above 5:1 sounds great but often means you're under-acquiring. You could profitably spend more to acquire customers you're currently not reaching. :::
Calculating by Channel
Track LTV:CAC for each acquisition source:
| Channel | CAC | 12-mo LTV | LTV:CAC |
|---|---|---|---|
| Organic Search | $15 | $180 | 12:1 |
| Google Ads Brand | $35 | $160 | 4.6:1 |
| Meta Ads | $55 | $145 | 2.6:1 |
| Google Ads Non-Brand | $85 | $130 | 1.5:1 |
| Influencer | $120 | $210 | 1.75:1 |
"Channel LTV varies dramatically. Customers from different sources have different intent, expectations, and value. Treating all CAC equally is a mistake."
CAC Payback Period
How quickly you recover acquisition costs.
Why Payback Matters
- Cash flow — Longer payback requires more working capital
- Risk — More time = more churn opportunity
- Growth capacity — Fast payback enables faster reinvestment
:::info Payback Formula Payback Period = CAC / (Monthly Revenue × Gross Margin)
Example: $150 CAC / ($30/month × 70% margin) = 7.1 months :::
Benchmarks by Business Model
| Business Model | Target Payback |
|---|---|
| E-commerce | 3-6 months |
| Subscription (consumer) | 6-12 months |
| SaaS (SMB) | 12-18 months |
| SaaS (Enterprise) | 18-24 months |
| Marketplace | 6-9 months |
Optimizing Advertising for CLV
How to find customers who stay, not just convert.
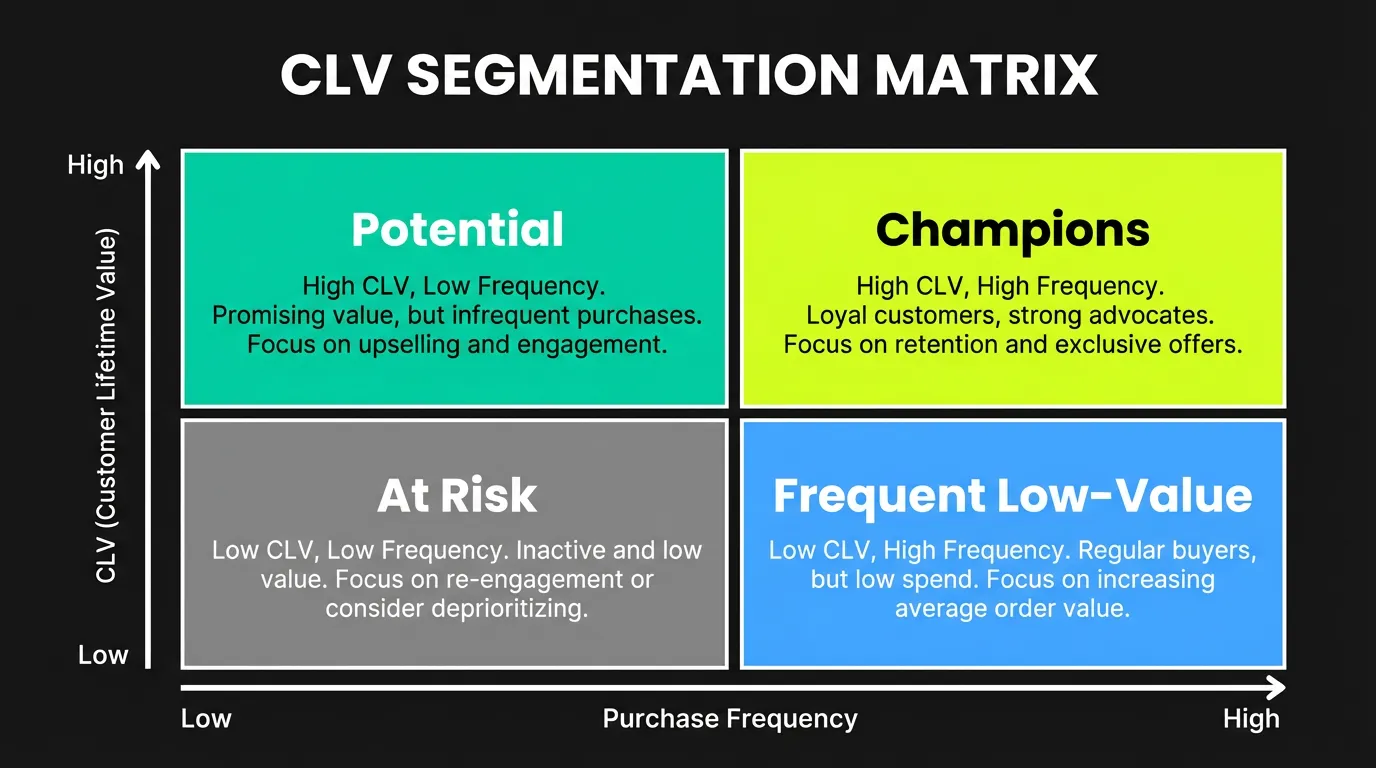
Step 1: Build CLV Segments
Create customer tiers based on lifetime value:
- Calculate historical CLV for all customers (12+ months old)
- Segment into tiers — Top 10%, 11-30%, 31-70%, Bottom 30%
- Identify distinguishing traits — What makes high-CLV customers different?
Common high-CLV indicators:
- Full-price first purchase (vs discount)
- Specific product categories
- Higher first order value
- Multiple items in first order
- Mobile app user
- Loyalty program member
Step 2: Find Lookalike Signals
Train algorithms on valuable customers:
:::tip Value-Based Lookalikes Instead of creating lookalikes from "all purchasers," create from "top 20% by CLV." This tells the algorithm to find people like your BEST customers, not just any customer. :::
Meta Custom Audiences:
- Upload customer list with LTV values
- Select "Customer Value" option
- Create Value-Based Lookalike
- Algorithm prioritizes finding high-value profiles
Google Value-Based Bidding:
- Import offline conversion values
- Use Smart Bidding with conversion value
- Set Target ROAS based on profitable CLV
Step 3: Optimize for LTV Events
Track events that predict lifetime value:
| Event | LTV Correlation |
|---|---|
| Add to wishlist | 2.1x higher LTV |
| Create account | 1.8x higher LTV |
| Subscribe to email | 1.6x higher LTV |
| Download app | 2.4x higher LTV |
| Second purchase | 3.2x higher LTV |
Optimize toward these events, not just first purchase.
Acquisition Strategies by CLV Goal
Strategy A: Maximize LTV (Premium Acquisition)
Approach: Accept higher CAC for significantly higher LTV
Tactics:
- Target higher income demographics
- Focus on brand awareness + consideration
- Premium creative with quality signals
- Limited discounting
- Retarget engaged non-converters longer
Best for: Luxury goods, premium subscriptions, high-margin products
:::highlight Premium Example A premium cookware brand found that Meta leads cost $95 vs $45 from Google Shopping. But Meta customers had 2.8x higher LTV due to brand affinity. The "expensive" channel was actually more profitable. :::
Strategy B: Optimize LTV:CAC Ratio
Approach: Balance acquisition cost with lifetime value
Tactics:
- Bid based on predicted CLV
- Channel mix optimization by LTV
- Micro-segmentation of campaigns
- Suppress low-LTV lookalikes
- A/B test creative for LTV impact
Best for: Most businesses, especially those with proven product-market fit
Strategy C: Minimize Payback Period
Approach: Acquire customers who pay back quickly
Tactics:
- High-intent keyword focus
- Retargeting warm audiences
- Upsell/cross-sell in acquisition flow
- Bundle promotions
- Annual vs monthly pricing push
Best for: Cash-constrained businesses, seasonal businesses
Creative Strategy for High-CLV Acquisition
Ad creative influences who you attract.
Discount vs Full-Price Messaging
:::warning The Discount Trap Customers acquired through heavy discounts have 50% lower LTV on average. The customer who pays $80 full price often outperforms the one who paid $40 at 50% off—even though short-term revenue was half. :::
Full-price buyer characteristics:
- Higher brand loyalty
- Lower price sensitivity
- Less likely to wait for sales
- More likely to refer others
Discount buyer characteristics:
- Price-motivated
- Higher churn rate
- Wait for next sale
- Lower engagement between purchases
Creative Elements That Attract High-CLV
| Element | Impact on CLV |
|---|---|
| Quality imagery | +15-20% LTV |
| Brand storytelling | +20-25% LTV |
| Customer testimonials | +10-15% LTV |
| Product education | +15-20% LTV |
| Urgency/scarcity | -10-15% LTV |
| Deep discounts | -30-50% LTV |
Retention's Impact on Advertising
Retention makes acquisition profitable.
The Retention-CLV Math
| Monthly Churn | Annual Retention | CLV Multiple |
|---|---|---|
| 10% | 28% | 1.0x (baseline) |
| 5% | 54% | 1.9x |
| 3% | 69% | 2.5x |
| 2% | 79% | 3.1x |
| 1% | 89% | 4.2x |
"A 5% improvement in retention can increase CLV by 25-95%. The most profitable advertising investment is often in keeping customers you've already acquired."
Acquisition + Retention Flywheel
Acquire high-CLV customers
       ↓
Retain through great experience
       ↓
Increase repeat purchases
       ↓
Generate referrals
       ↓
Lower effective CAC
       ↓
Higher LTV:CAC ratio
       ↓
Reinvest in acquisition
       ↓
(Repeat)
Measuring CLV in Ad Platforms
Google Ads: Conversion Value Rules
Set different values by audience:
- Go to Tools → Conversions → Value Rules
- Create rules based on:
- Audience lists (high-value customers)
- Location (markets with higher LTV)
- Device (if app users have higher LTV)
- Adjust reported conversion value accordingly
:::tip Example Value Rule If customers who purchase via mobile app have 50% higher LTV, create a rule that increases conversion value by 50% when device = mobile. :::
Meta: Conversion API with LTV
Send actual customer value through CAPI:
- Initial purchase — Send transaction value
- Subsequent purchases — Update with cumulative value
- LTV prediction — Send predicted LTV as event value
This trains Meta's algorithm on actual customer value, not just conversion count.
Building CLV Dashboards
Track these metrics monthly:
| Metric | What to Monitor |
|---|---|
| Average CLV | Is it increasing over time? |
| CLV by cohort | Are recent customers more/less valuable? |
| CLV by channel | Which sources bring valuable customers? |
| LTV:CAC trend | Is unit economics improving? |
| Payback by channel | Where is capital recovering fastest? |
Advanced CLV Strategies
Predictive CLV Modeling
Use machine learning to predict value at acquisition:
Input features:
- First purchase amount
- First purchase category
- Acquisition channel
- Device type
- Geographic location
- Time to first purchase
- Marketing touchpoints
Output: Predicted 12-month, 24-month, lifetime value
:::info ML CLV Benefits With predictive CLV, you can personalize acquisition spend in real-time. Bid more for prospects who look like high-value customers before they even convert. :::
CLV-Based Bid Strategies
Set bids based on predicted customer value:
Target CPA by CLV Segment:
├── High CLV (top 20%): Target $120 CPA
├── Medium CLV (middle 50%): Target $60 CPA
└── Low CLV (bottom 30%): Target $25 CPA

Why: All are profitable if CAC < 1/3 LTV
Negative Targeting for CLV
Exclude audiences likely to have low CLV:
- Serial returners
- Heavy discount seekers
- One-time purchase patterns
- Low engagement segments
- High churn prediction scores
Common CLV Mistakes
1. Ignoring Time Value of Money
"A customer worth $1,000 over 5 years = $1,000 value"
Reality: Apply discount rate. $1,000 over 5 years at 10% discount rate = ~$620 present value.
2. Confusing Revenue with Profit
"Our customers spend $500 average, so CLV = $500"
Reality: CLV should reflect contribution margin after COGS, fulfillment, and variable costs.
3. Optimizing for Average CLV
"We optimize for average customer value"
Reality: Optimize for marginal CLV. The question isn't "what's average customer worth?" but "what's the NEXT customer worth at this CPA?"
4. Not Segmenting CLV
"All our customers have similar value"
Reality: CLV follows power law distribution. Small changes in which customers you attract dramatically affect average CLV.
5. Short-Term Measurement Windows
"We measure 30-day ROAS to judge campaigns"
Reality: 30-day windows miss repeat purchases. Use blended metrics that account for future value.
The Bottom Line
CLV-based advertising is about playing the long game:
- Calculate your CLV — Historical, predictive, and segmented
- Know your LTV:CAC ratio — By channel, campaign, and creative
- Optimize for value, not volume — Fewer high-CLV customers beat many low-CLV
- Train algorithms on value — Use value-based bidding and lookalikes
- Adjust creative strategy — What you say attracts who you get
- Measure long-term — Short-term ROAS misses the full picture
:::tip The CLV Mindset "Stop asking 'how cheaply can we acquire customers?' Start asking 'how can we acquire customers worth acquiring?'" :::
"The businesses that win in 2026 won't be the ones acquiring the most customers. They'll be the ones acquiring the right customers—those whose lifetime value far exceeds acquisition cost."
AdBid helps you track customer lifetime value across acquisition channels. See which campaigns bring customers who stay. Start your CLV analysis.