Key Takeaways
- Businesses implementing systematic A/B testing see 25-40% ROAS improvement in first quarter
- AI-enhanced testing (like Bing's implementation) showing 25% revenue increases
- A/B testing market projected to reach $1.25B by 2028 (11.5% CAGR (Business Research Insights))
- Statistical significance at 95% confidence essential for valid conclusions
- Test one variable at a time — the golden rule still applies
:::highlight The Testing Imperative "In 2026, data-backed iteration isn't optional. With rising acquisition costs, shrinking attention spans, and increased buyer skepticism, marketers can't afford to rely on gut feel." — Every data-driven marketer :::
Why A/B Testing Matters More Than Ever
The advertising landscape has become more complex and competitive:
For teams that need more campaign-ready variations, AdBid's AI creative factory helps turn briefs into hooks, copy, and ad assets faster.
| Challenge | Why Testing Helps |
|---|---|
| Rising CAC | Find more efficient creative/targeting |
| Shorter attention spans | Identify what hooks fastest |
| Privacy restrictions | Understand what works despite less data |
| Platform algorithm changes | Adapt quickly to new realities |
| Creative fatigue accelerating | Know when to refresh |
"Businesses implementing systematic testing protocols typically see a 25-40% improvement in ROAS within the first quarter."
The Fundamentals of A/B Testing
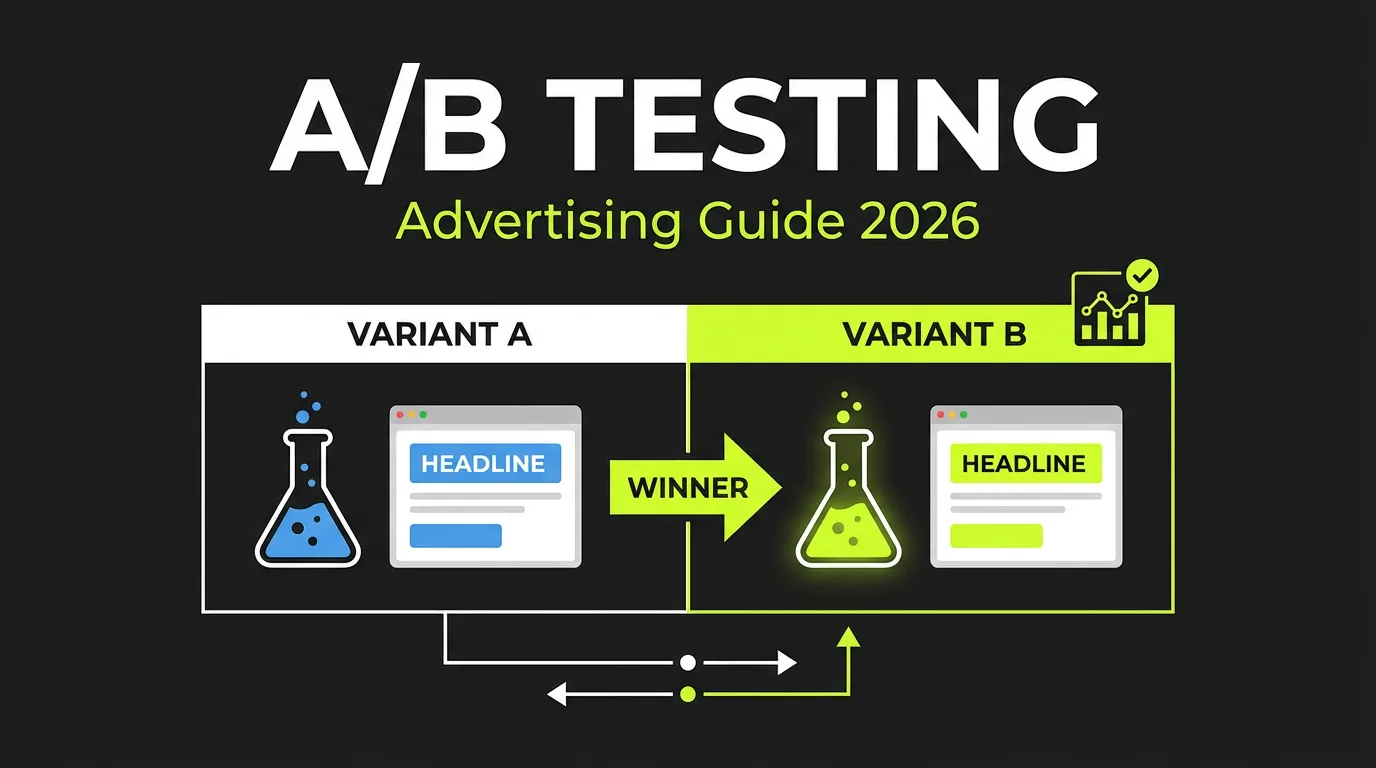
What Is A/B Testing?
A/B testing (split testing) compares two versions of an element to determine which performs better:
- Version A (Control): Current approach
- Version B (Variant): Modified approach
- Metric: The outcome you're measuring
- Statistical significance: Confidence the result isn't random
The Golden Rules
:::warning Critical Rules
- Test one variable at a time — Otherwise you can't know what caused the difference
- Achieve statistical significance — 95% confidence minimum
- Adequate sample size — Calculator before starting
- Sufficient duration — Account for day-of-week variation (minimum 7 days)
- No peeking — Don't stop early based on preliminary results :::
Sample Size Calculation
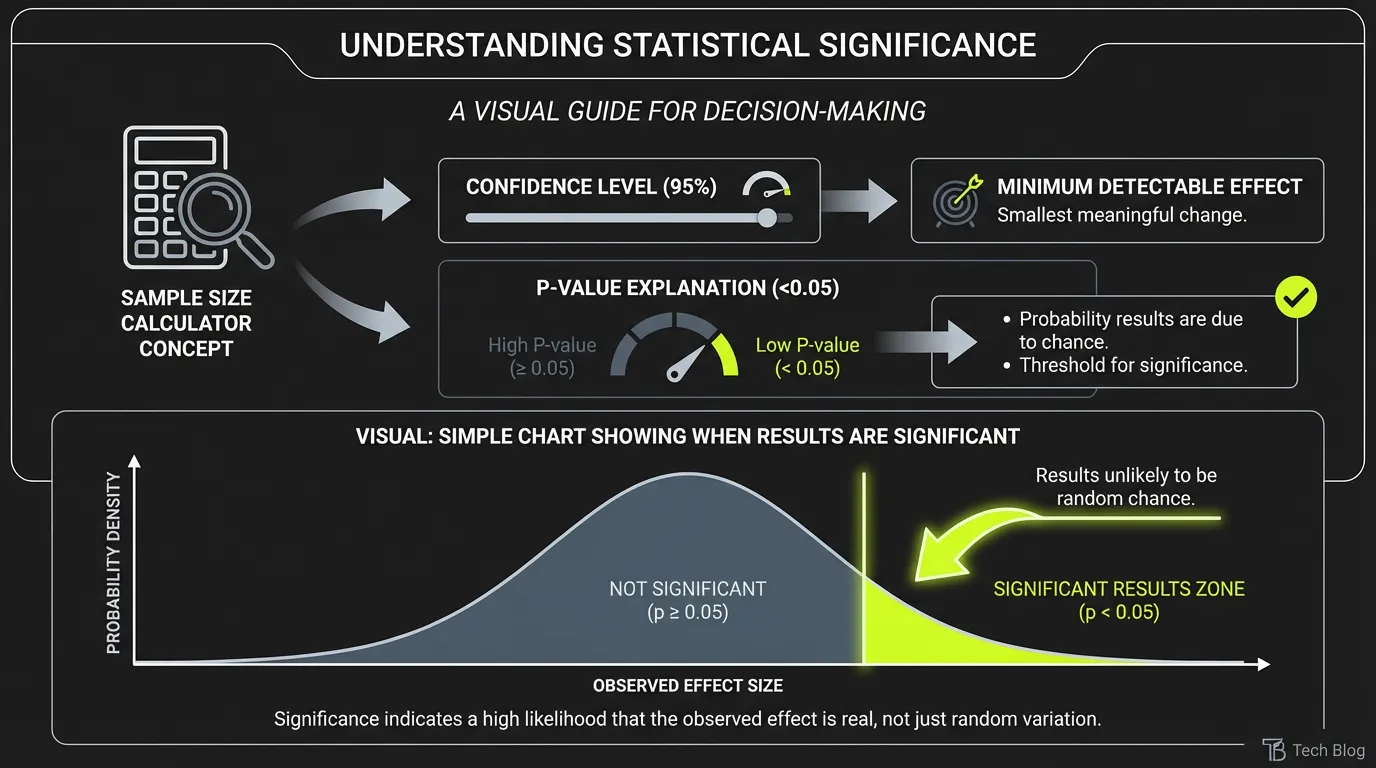
Before testing, determine required sample size based on:
- Current conversion rate
- Minimum detectable effect (MDE)
- Statistical power (typically 80%)
- Significance level (typically 95%)
Rule of thumb: For a 10% lift at 95% confidence, you need roughly 3,900 conversions per variant.
What to Test in Advertising
Creative Elements
| Element | Priority | Typical Impact |
|---|---|---|
| Headlines | High | 20-50% CTR change |
| Images/video | High | 30-100% performance change |
| CTA buttons | High | 15-30% conversion change |
| Body copy | Medium | 10-20% engagement change |
| Social proof | Medium | 15-25% conversion change |
| Color schemes | Low | 5-15% CTR change |
Ad Copy Tests
Test these copy elements systematically:
Headlines:
- Benefit-focused vs. feature-focused
- Question vs. statement
- Numbers vs. no numbers
- Short vs. long
Body:
- Emotional vs. logical appeal
- Urgency vs. value proposition
- Social proof placement
- Problem-agitation-solution structure
:::tip High-Impact Copy Tests Start with headlines — they're seen first and have the biggest impact. A headline change can improve CTR by 30-50% while body copy changes typically yield 10-20% improvement. :::
Visual Tests
Image variations:
- People vs. no people
- Lifestyle vs. product-focused
- Single product vs. multiple
- Light vs. dark backgrounds
- Faces looking at camera vs. at product
Video variations:
- Hook style (question, statistic, statement)
- Length (15s vs. 30s vs. 60s)
- Pacing (fast cuts vs. smooth)
- CTA placement and timing
- Music vs. voiceover
Targeting Tests
Audience testing:
- Broad vs. specific targeting
- Interest-based vs. behavioral
- Lookalike percentages (1% vs. 5%)
- Custom audiences vs. prospecting
Placement testing:
- Feed vs. Stories vs. Reels
- Mobile vs. desktop
- Automatic vs. manual placements
Bid and Budget Tests
Strategy testing:
- Manual vs. automated bidding
- CPA vs. ROAS optimization
- Budget levels and scaling approaches
Platform-Specific Testing Features
Meta Ads A/B Testing
Meta's Experiments feature allows controlled tests:
- Ad level testing — Creative variations
- Ad set level testing — Audience and placement
- Campaign level testing — Objectives and strategies
Setup:
- Go to Experiments in Ads Manager
- Choose A/B Test
- Select variables to test
- Set duration and success metric
- Launch and wait for significance
Google Ads Experiments
Google's campaign experiments split traffic:
- Campaign Experiments — Test bidding, targeting changes
- Ad Variations — Test copy changes at scale
- Drafts — Stage changes before testing
Best practices:
- Use 50/50 traffic split
- Run for minimum 2 weeks
- Test during stable periods (avoid Black Friday)
TikTok Split Testing
TikTok Ads Manager split testing options:
- Creative A/B testing
- Targeting A/B testing
- Bidding and optimization testing
:::info Platform Limitations Platform-native testing tools have limitations. For true statistical rigor, consider third-party tools like Optimizely, VWO, or custom solutions. :::
Statistical Rigor
Understanding Confidence Intervals
"A 95% confidence level means there's only a 5% chance your result is random."
What confidence levels mean:
- 90% — Acceptable for directional learning
- 95% — Standard for decision-making
- 99% — Required for high-stakes changes
Common Statistical Mistakes
:::danger Avoid These Errors
- Stopping early — "Version B is winning after 2 days!" (Not enough data)
- Multiple comparisons — Testing 10 variants multiplies false positive risk
- Ignoring sample size — Small differences with small samples are meaningless
- Testing during anomalies — Holiday periods skew results
- Not accounting for variance — Day-to-day fluctuations are normal :::
Sequential Testing
For faster results with statistical validity:
- Use sequential testing methods (group sequential design)
- Pre-specify interim analysis points
- Adjust significance thresholds for multiple looks
- Tools like Optimizely handle this automatically
AI-Enhanced A/B Testing
How AI Changes Testing
The integration of AI has revolutionized optimization:
"Bing reported a 25% increase in ad revenue through AI-enhanced testing methods." — Microsoft Advertising
AI testing capabilities:
- Automatic variant generation
- Faster significance detection
- Multi-armed bandit optimization
- Predictive performance modeling
- Automated creative iteration
When to Use AI vs. Traditional Testing
| Use AI Testing | Use Traditional A/B |
|---|---|
| High volume, many variants | Few variants, need certainty |
| Continuous optimization | One-time decisions |
| Creative rotation | Major strategy changes |
| Performance marketing | Brand campaigns |
Building a Testing Culture
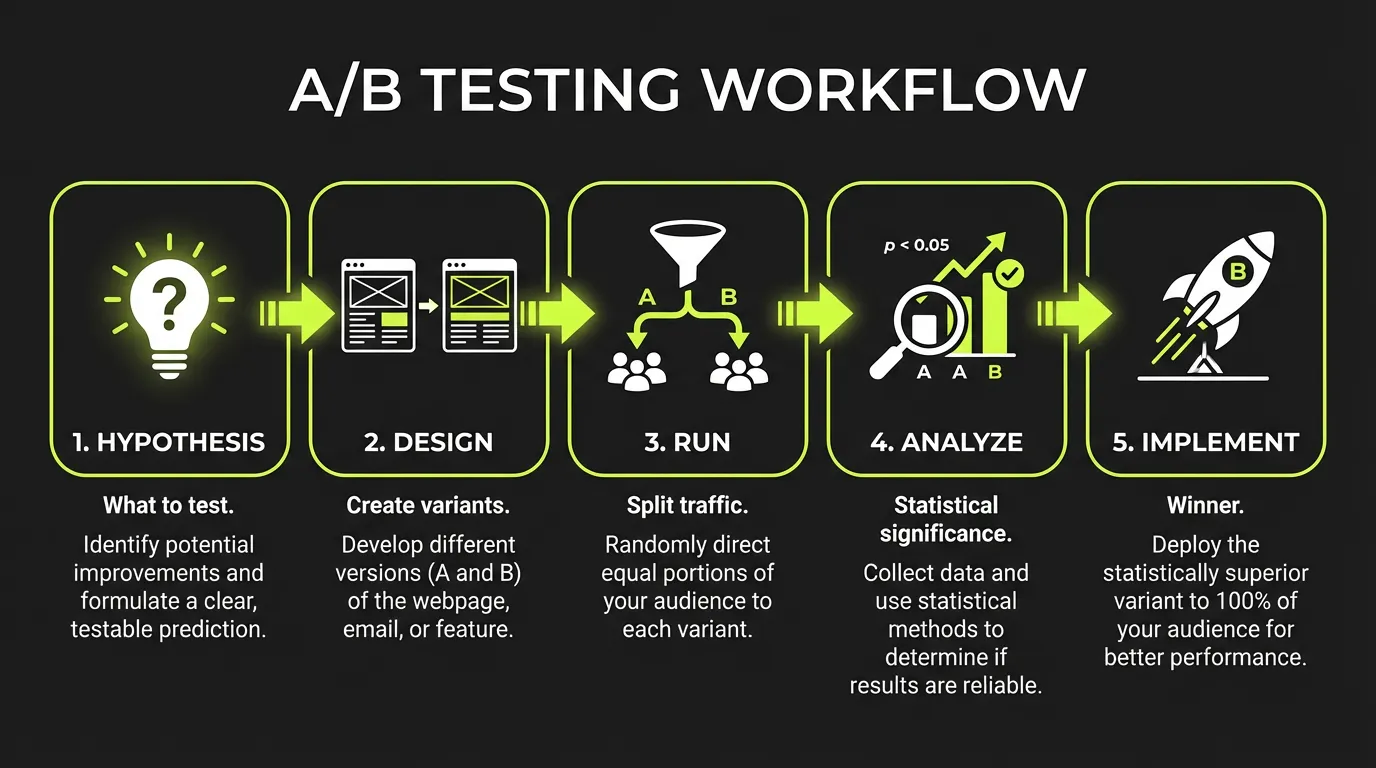
Testing Framework
Systematic approach to testing:
Phase 1: Hypothesis
- What do you believe will happen?
- Why do you believe it?
- What evidence supports this?
Phase 2: Design
- One variable isolation
- Sample size calculation
- Duration planning
- Success metrics definition
Phase 3: Execution
- Launch A/B test
- Monitor for technical issues
- No peeking at results
- Document everything
Phase 4: Analysis
- Check statistical significance
- Calculate confidence intervals
- Segment results (device, audience, placement)
- Document learnings
Phase 5: Implementation
- Roll out winner (if significant)
- Plan next test based on learnings
- Update knowledge base
Testing Roadmap Template
| Quarter | Focus Area | Tests | Expected Impact |
|---|---|---|---|
| Q1 | Headlines | 12 tests | 15% CTR improvement |
| Q2 | Creative format | 8 tests | 20% engagement lift |
| Q3 | Audience targeting | 6 tests | 10% ROAS improvement |
| Q4 | Landing pages | 10 tests | 25% CVR improvement |
Measuring Success
Test Analysis Checklist
✅ Statistical significance reached (95%+ confidence) ✅ Adequate sample size achieved ✅ Test ran long enough (7+ days minimum) ✅ No external factors contaminating results ✅ Results consistent across segments ✅ Practical significance (not just statistical)
What to Do With Results
When test wins:
- Implement at scale
- Document the learning
- Plan iteration tests
- Share with team
When test loses:
- Understand why
- Document the learning
- Try different approach
- Don't give up on hypothesis entirely
When inconclusive:
- Need more traffic/time
- Variable may not matter much
- Move to higher-impact tests
:::tip The Learning Mindset Failed tests aren't failures — they're learnings. A test that shows no difference teaches you what doesn't matter, freeing you to focus elsewhere. :::
The Bottom Line
Effective A/B testing in 2026 requires:
- Statistical rigor — 95% confidence, adequate sample sizes
- One variable at a time — Isolate what you're learning
- Systematic approach — Testing roadmap and documentation
- Patience — Don't peek or stop early
- Learning culture — Every test teaches something
The gap between guessing and knowing is your competitive advantage.
AdBid helps you track A/B test performance across platforms. See which creative variations drive real business results. Start optimizing.